SNP & Variation Suite: Cohort Analysis of Microarray & Sequencing Data
Powerful GWAS software for population genetics, cohort analysis, and research-scale genomic studies. Perform complex analysis and visualization on thousands of samples without requiring programming expertise.
Genome-wide association studies (GWAS) and cohort analysis are essential for identifying genetic variants linked to disease and complex traits. As sample sizes grow into the tens of thousands, researchers require robust GWAS software that provides the statistical rigor necessary for discovery across massive datasets.
Golden Helix SNP & Variation Suite (SVS) is a powerful SNP analysis software platform that delivers complex cohort genomic analysis through an intuitive interface. By eliminating the need for programming expertise, SVS empowers researchers to perform advanced statistics and visualize findings with ease.
What Is GWAS & Cohort Analysis?
GWAS identifies disease-susceptible genes by comparing the genetic variants of individuals with a specific trait or disease against a control group. This approach pair effective analytical methods with an understanding of genetic variation to identify variants related to disease genes.
- Genotype Association Testing: Testing for association against dichotomous or quantitative traits using various genetic model assumptions.
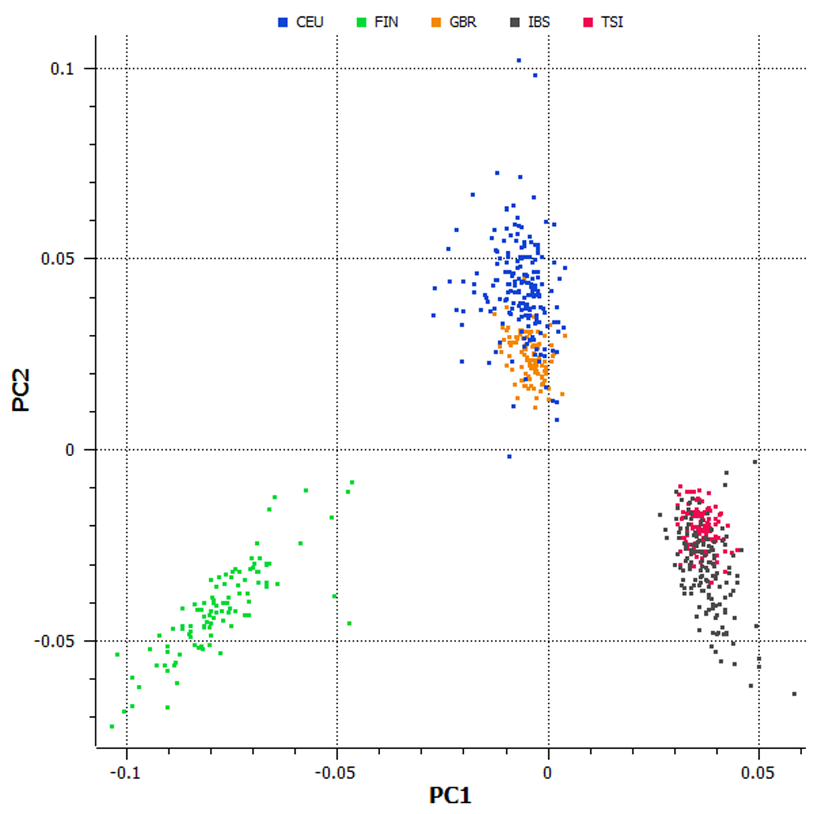
- Population Stratification: Detecting and correcting for ancestry-driven differences that can lead to false positive results.
- Linkage Disequilibrium (LD): Analyzing how variants are inherited together to identify haplotype blocks and functional regions.
Why Population Genomics Matters
Advanced population genetics software allows researchers to move beyond single marker associations to understand the polygenic nature of complex diseases and traits.
Whether you are working in human genetics, agricultural genomics, or veterinary research, the ability to analyze thousands of samples at once enables:
- Polygenic Risk Scores (PRS): Identifying correlations between genotypic variants and phenotypes across large populations for predictive modeling.
- Genomic Prediction: Determining which animals or plants merit breeding for desired traits based on estimated breeding values.
- Imputation: Scaling analysis from common variants to rare variants by imputing missing genotypes using high-density reference panels.
What to Look for in GWAS & Research Genomics Software
Scalability
The software must handle microarray, whole-exome, and whole-genome data for thousands of samples without performance bottlenecks.
Statistical Rigor
Built-in methods for PCA, regression, mixed linear models, and multiple testing corrections to ensure publishable results.
User Accessibility
Empower biologists with intuitive, point-and-click workflows that eliminate the need for command-line scripting.
Multi-Species Support
Support for human, plant, and animal builds with custom annotation capabilities for diverse research fields.
Data Integration
Native support for VCF, Affymetrix CEL, and data from Agilent, NimbleGen, and Illumina platforms.
Interactive Visualization
Dynamic Manhattan plots, LD structures, heat maps, and a genome browser to identify significant findings instantly.
How Snp Variation Suite (SVS) Powers Research Genomics
SVS delivers a world-class analytic tool and powerful visualizations in a user-friendly interface. It implements best practices and the latest algorithms, supporting a broad array of data formats for import, quality assurance, and statistical testing.
Advanced Statistical Methods
Implements Genomic Best Linear Unbiased Predictors (GBLUP), Bayes C, and Bayes C-Pi for polygenic risk score software applications and genomic prediction.
Integrated Imputation
Features an adapted BEAGLE 4.1 algorithm scaling to tens of thousands of samples with pre-built reference panels for 1000 Genomes Project data.
Visual Discovery
Interactive display of p-values, raw data, and annotation sources in a unified view with smart labeling and natural pan/zoom controls.
Manage billions of data points across thousands of samples with multi-omic integration.
The SVS Research Workflow
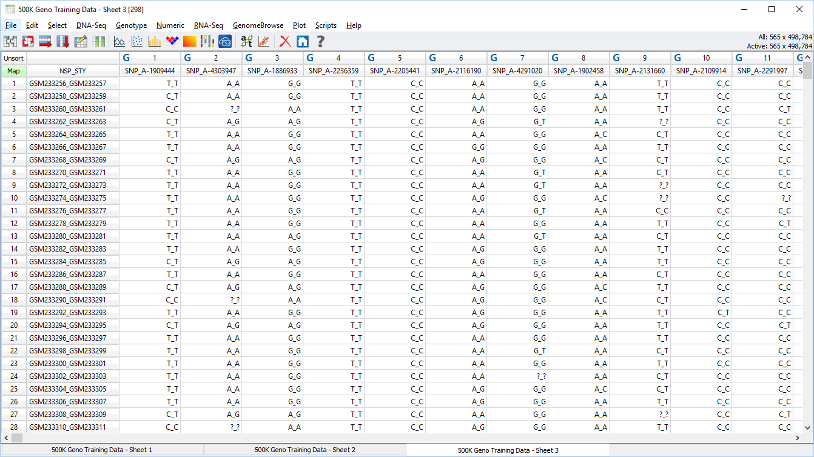
Data Import & QC
Directly import VCF, CEL, or text files. Run quality assurance filters for call rate, HWE, and Mendelian errors to ensure high-quality data.
Population Structure
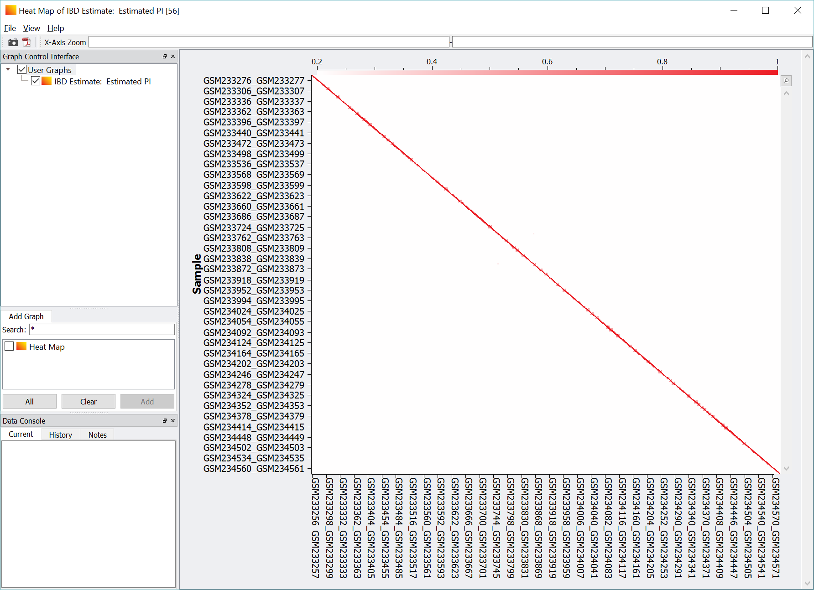
Run Large Data PCA to identify population stratification. Calculate IBS/IBD to detect cryptic relatedness across thousands of samples.
Association Testing
Perform association tests for binary or quantitative traits. Correct for stratification using PCA results or mixed linear models.
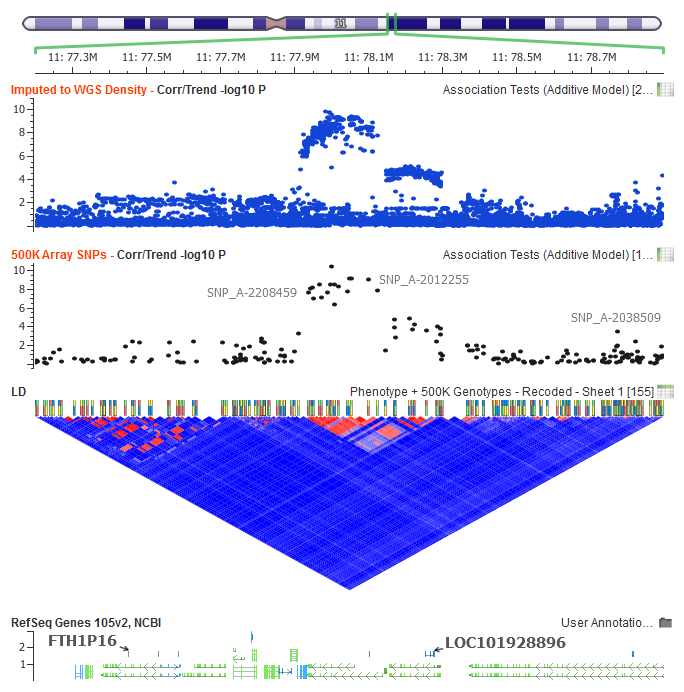
Discovery & Visualization
Explore results with Manhattan plots and LD plots. Integrate with Golden Helix GenomeBrowse to visualize variant context and annotation sources.
Advanced Population Visualization
SVS provides a comprehensive suite of interactive visualizations designed to turn massive genomic datasets into actionable insights.
- Manhattan Plots: Genome-wide significance visualization for association results
- PCA Scatter Plots: Visual detection of population stratification and ancestry clusters
- IBD Matrix Heatmaps: Relatedness and shared ancestry analysis at scale

Comprehensive Research Capabilities
Genome-Wide Association (GWAS)
Execute advanced SNP analyses with regression, meta-analysis, and LD/haplotype tools. SVS supports linear and logistic regression with gene-by-environment interactions.
View visualization toolsGenomic Prediction & PRS
Build predictive models using GBLUP and Bayes methods. SVS handles polygenic risk score software requirements with K-fold cross-validation for both human and animal genomics.
Polygenic Risk Scoring articleCohort DNA-Seq Analysis
Integrate rare variant analysis with region-based collapsing methods. SVS handles large-scale sequencing cohorts, providing variant classification similar to ANNOVAR.
Exome analysis workflowsRNA-Seq Differential Expression
Provide differential expression workflows using DESeq. Generate volcano plots, hierarchical clustering, and heatmaps to verify biological grouping and significance.
Copy Number Analysis (CNV)
Complete toolset for identification, visualization, and association analysis of CNVs from microarray or sequencing data using the CNAM dynamic programming algorithm.
Comprehensive Variant Annotation
Prioritize and interpret variants using an extensive library of population, functional, and clinical annotations. SVS integrates dbSNP, 1000 Genomes, ClinVar, and functional predictions directly into your workflow.
Factual Precision for Research Discovery
SVS has been used by researchers worldwide for over a decade, empowering discoveries in complex disease, agricultural yield, and population history.
The new Large Data PCA handles over 10x as many samples as previous methods, scaling to the needs of modern population-scale biobanks.
Frequently Asked Questions
Do I need to know how to code to use SVS?
No. SVS is designed with an intuitive, point-and-click interface that handles all complex data management and statistical calculations automatically. While it offers programmatic access for advanced users, no coding knowledge is required for the full GWAS workflow.
What species are supported by SVS?
SVS supports multiple species including humans, plants, and animals. It includes pre-built genomic builds and allows users to add custom species and annotations through a point-and-click interface, making it ideal for agricultural and veterinary research.
Can SVS handle whole-genome sequencing (WGS) data?
Yes. SVS handles massive datasets from microarray panels to whole-genome and imputed datasets across thousands of samples. It includes specialized tools for importing and managing large-scale VCF files.
What statistical methods are implemented for GWAS?
SVS implements a broad array of rigorous methods including linear and logistic regression, PCA for population stratification, mixed linear models, GBLUP, Bayes C, and multiple testing corrections like permutation testing.
Can I create publication-quality plots in SVS?
Yes. SVS's powerful visualizations, including Manhattan plots, LD structures, and PCA scatter plots, can be exported to high-resolution, publication-quality images. This ensures your research findings are ready for peer-reviewed journals and academic presentations.
GWAS & Population Research Insights
Deep dives into polygenic risk scores, large-scale PCA, and best practices for genome-wide association studies.
Ready to Scale Your Research Discovery?
Join thousands of researchers worldwide using SNP & Variation Suite for their most demanding cohort genomics projects.