Thank you to those who attended our recent webcast on Golden Helix’s SNP & Variation Suite (SVS) and its new capability related to Polygenic Risk Scores (PRS). If you were unable to attend, a recording can be found via this link.
For common diseases, PRS can provide a predictive value related to the disease risk at an individual level. By incorporating multiple genomic loci, PRS offers a broader view of the genetic landscape contributing to disease susceptibility. It leverages the collective impact of many small-effect variants, delivering a comprehensive evaluation of an individual’s genetic predisposition to complex polygenic disorders. Thus, these scores can be instrumental in predictive health modeling, informing the overall risk profile of an individual and possibly guiding targeted prevention and treatment strategies. This can be one component of a personalized medicine healthcare strategy, and Polygenic Risk Scores are gradually being integrated into clinical applications.
Model Building and Validation
PRS models can be built from the output of various GWAS or other association testing test statistics. It requires information from the single-marker test, such as the P-Value, to compute a coefficient that represents the marker’s effect size.
A couple of things are considered when selecting which markers to put into a PRS model:
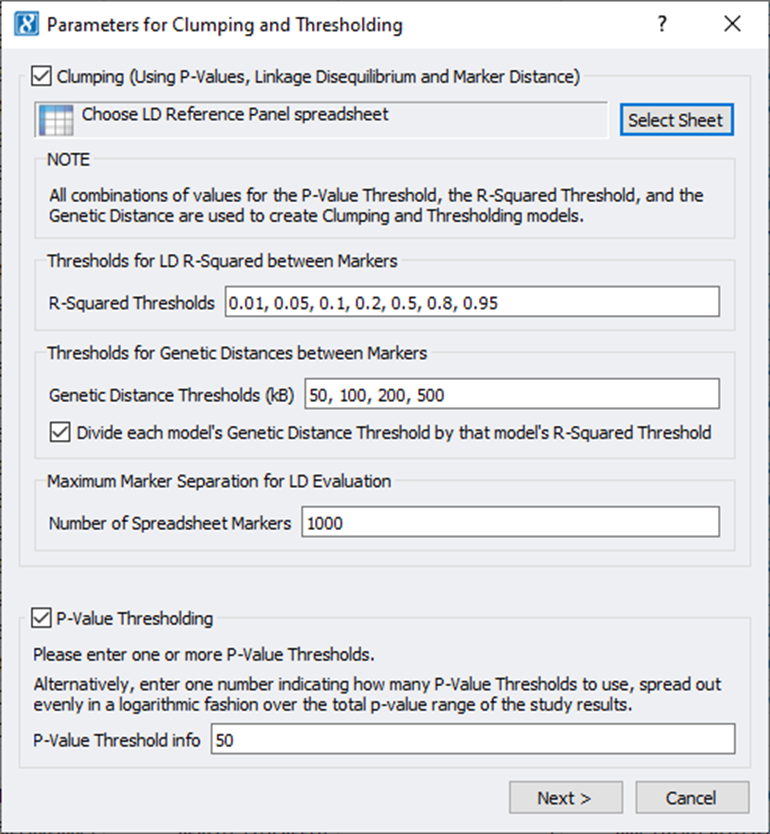
- P-Value threshold: Markers with higher -log10 P-values should be included, but at some point the additive value diminishes when including more markers
- LD-Structure: Markers in high-LD should not be added to the model as they are encoding the same signal
- Genomic distance: To get to a polygenic model, markers should be spaced out appropriately across the genome
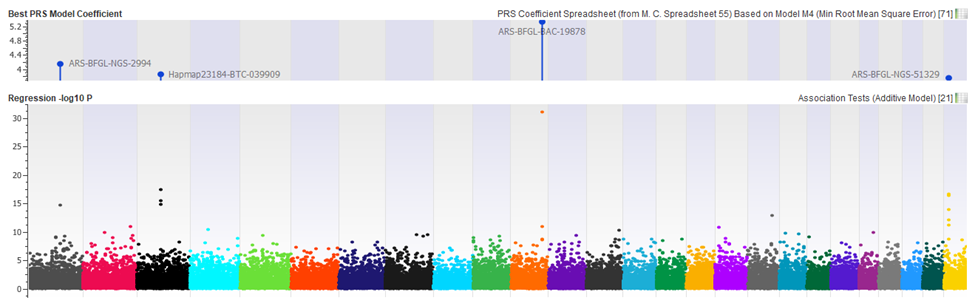
SVS implements a Clumping and Thresholding technique that varies all these parameters in a combinatorial fashion and builds many models reflecting this search strategy. Models can then be tested against a Test or Validation dataset to measure their performance in predicting the phenotype (comparing a predicted phenotype to the actual phenotype). Finally, a single model or a blend of well-performing models can be selected that optimizes a model-performance parameter.
With a PRS model defined, SVS can predict phenotypes for samples with unknown outcomes or test the performance of a defined model against other validation datasets.
Webcast Questions
From the webcast we had several questions, some of which we did not have time to answer:
Q: Can whole exome or whole genome NGS data base used as a starting point?
A: Absolutely. SVS supports import VCF files and includes annotation and filtering capabilities to select common variants that would be appropriate inputs for single-marker association tests. Exomes would require some review because it may not contain many common variants, given the focus on coding regions which harbor fewer common tagging SNPs.
Q: Can the tool correct for unbalanced case/control sample sizes (i.e. 100 cases and 1,000 controls) and does it have corrections for close relationships or inbreeding.
A: Yes, SVS has a number of ways to handle sample relatedness. I suggest exploring using a Mixed Linear Model analysis with a Genomic Relationship Matrix (MLM and GBLUP) to correct for the relatedness and prevent cryptic relatedness from driving association test results. The output of our MLMM analysis can be used as inputs to PRS. The unbalanced case/control counts can result in good quality statistics, depending on if the cases are diverse enough to capture the variation in the population.
Q: Can the PRS modeling be built from association tests created or published outside SVS?
A: Yes, we support importing existing test statistics for markers and using those as the basis for the Clumping and Thresholding strategy. In fact, the method will be able to impute effect size if it is not directly available in the association test results using several different strategies. You can also import fully built models and apply those to new samples.
SNP & Variant Suite 8.10.0 Release
Along with the webcast this week, we are happy to announce the release of SVS 8.10 with these new PRS capabilities. There are several additional improvements to SVS this release as well, building on our ever-expanding annotation algorithms and curated data library. See our release notes for more information, you can log into our support page and see SVS 8.10.0 Release Notes.
If you are new to SVS and would like to use it on your own data, please contact us. If you have any questions about how to upgrade SVS to 8.10.0 or if you have any other questions, please reach out to our field application scientist team at [email protected].