
When quality metrics generated during secondary analysis are not incorporated into interpretation and reporting, variants are reported without the important context that could affect confidence in the call. The Golden Helix software suite has been designed to help you bring in quality metrics from secondary analysis through to interpretation and reporting. When using VarSeq, it’s essential to leverage the software’s features not only for tertiary analysis but also to assess the quality of your data.
Here are three key considerations for incorporating quality metrics into your VarSeq, VSClinical, and VSWarehouse workflows, enabling you to maximize clinical yield while maintaining the integrity of the underlying data.
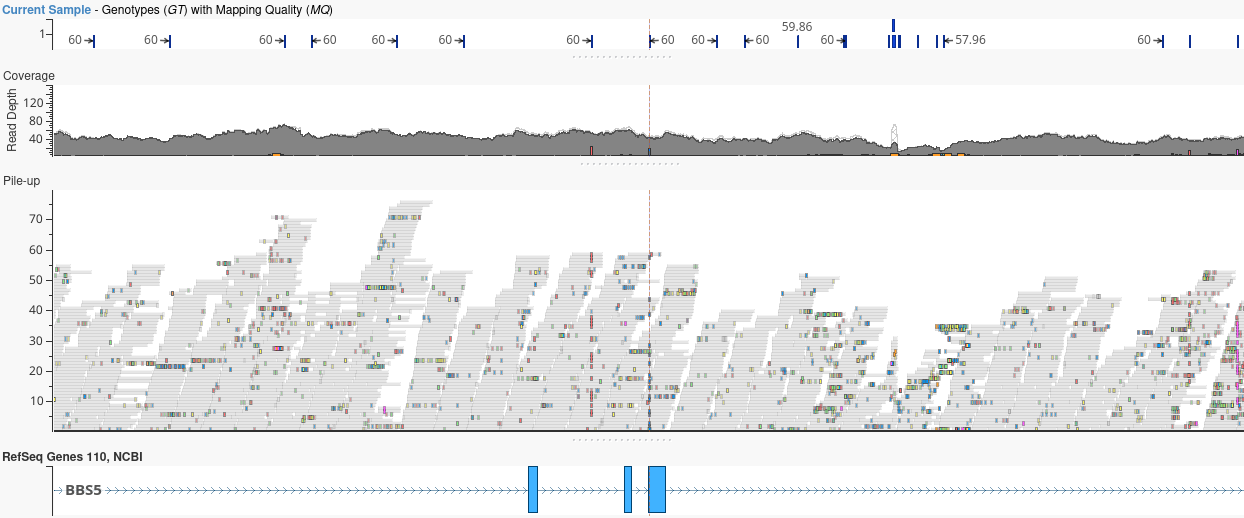
When Does “30x Coverage” Actually Mean Confident Calls?
The main goal of any DNA sequencing effort is to generate data that accurately represents the genetic information in the sample. When someone says “30x whole genome,” they usually mean average read depth: the total number of aligned bases divided by the genome size. That’s a very coarse number. Variant-level coverage metrics provide a better vantage point for assessing where your data is robust enough to make confident calls and where it’s too thin to trust. Without information about the depth of sequencing read coverage per variant, you risk flagging variants as clinically relevant when evidence supporting that particular variant call is actually too sparse.
Upon VCF file import, VarSeq automatically integrates per-variant coverage metrics into the variant table, enabling filtering on these values and allowing quick visualization of a histogram of read depth across variants. You can also compute coverage from the alignment file using VSPipeline and visualize the read pileup in GenomeBrowse.
Automatically Bring QC Fields Into VarSeq and VSClinical
Your variant caller, regardless of the platform you choose, generates a wealth of high-quality information, including read depth, allelic depths, genotype qualities, mapping quality, and more. In addition to the variant call itself, these quality indicators can be preserved during VCF import and carried alongside the variant call all the way to the final report.
Using automated workflows in VSWarehouse 3, VSPipeline imports quality metrics from secondary analysis stages, making coverage metrics immediately available for visualization, filtering, and reporting in VarSeq and VSClinical. By adding these metrics to the filter chain and saving the project as a template, consistent quality standards can be applied across all projects built from that template. This automated integration ensures that every sample receives the same rigorous assessment without manual intervention.
In VSWarehouse 3, catalogs can be leveraged to track sample-level quality metrics in a Sample Catalog, which is useful for monitoring batch-level quality scores and trends in data quality over time. Using the Sample Statistics algorithm, useful QC values can be added to each sample’s record in the catalog (e.g., TiTv Ratio, Variant Count, Heterozygous Rate, Call Rate, etc.). If artifacts are detected in the data, a dedicated Artifacts Catalog can be created to document known variant artifacts to be filtered.
Make Quality Metrics Visible in Final Reports
VSClinical and PGx report templates can include quality summaries, populated from the same quality metrics used throughout your VarSeq workflow. Coverage tables, sample quality status, and variant-level quality indicators can all be automatically integrated into report templates. This ensures consistency and eliminates manual transcription errors. VarSeq’s report template system enables you to customize quality sections that pull directly from project data, ensuring that quality information is never manually entered. With some custom curation of the report template, the quality section of a report can be as extensive as desired, incorporating quality metrics from secondary analysis or even the original sequencing run.
Consider adding a dedicated “Quality Summary” section to your report templates. This section can be designed to automatically pull quality metrics from the project, creating a standardized quality overview that appears in every report. By keeping sample-level quality information in the Sample Catalog, the quality data can be automatically integrated into reporting while also being cataloged for future reference.
Conclusion
The path from sequencing data to clinical report shouldn’t be a black box. Every step should automatically preserve and surface quality information. When quality metrics are generated and preserved throughout your workflow, you maximize clinical yield by finding more actionable variants. VarSeq and VSWarehouse enable scalability by consistently processing hundreds of samples.