
We’re excited to announce a powerful new feature in GenomeBrowse that enhances our support for visualizing long-read sequencing data: the ability to color reads by base modifications, such as DNA methylation, directly from BAM and CRAM alignment files.
Long-read sequencing technologies like those from PacBio and Oxford Nanopore have unlocked the potential to directly detect base modifications, including cytosine methylation and hydroxymethylation. Golden Helix’s long-read analysis workflows are designed to take full advantage of these capabilities. These epigenetic markers play a critical role in gene regulation, making their accurate visualization crucial for genomic analysis.
Base Modifications in BAM Files
Base modifications in BAM files are encoded using specialized tags. The MM tag indicates which bases are modified, while the ML tag provides a probability of each modification.
The MM tag encodes which bases are potentially modified and where each modification occurs. For example, C+m,5,12,0 describes three potential 5-Methylcytosine sites on the positive strand, with the first occurring after 5 unmodified cytosines, the second after the next 12 unmodified cytosines, and the third immediately following. Thus, the 6th, 19th and 20th bases have modifications.
The ML tag provides modification probabilities for each site identified in the MM tag, encoded as integers from 0-255 that map to probability ranges from 0.0-1.0. For example the MM tag “C+m,5,12;C+h,5,12;” may have an associated ML tag of “C,204,89,26,130”. In this example, the 6th cytosine has an 80% (204/255) chance of methylation, a 10% (26/255) chance of hydroxymethylation and a 10% chance of being unmodified.
While this tagging scheme is highly efficient for data storage, its complexity makes it difficult to interpret without the aid of a visualization tool or dedicated NGS analysis software.
Base Modification Coloring in GenomeBrowse
To make sense of this complex information, GenomeBrowse uses an intuitive coloring scheme which is designed to provide immediate visual insight into modification confidence. When displaying cytosine methylation bases are colored as follows:
- Red for modified bases with probability > 50%
- Blue for modified bases with probability < 50%
- Alpha transparency increases as probability approaches 50%, so highly confident modifications appear solid, while uncertain modifications appear more transparent
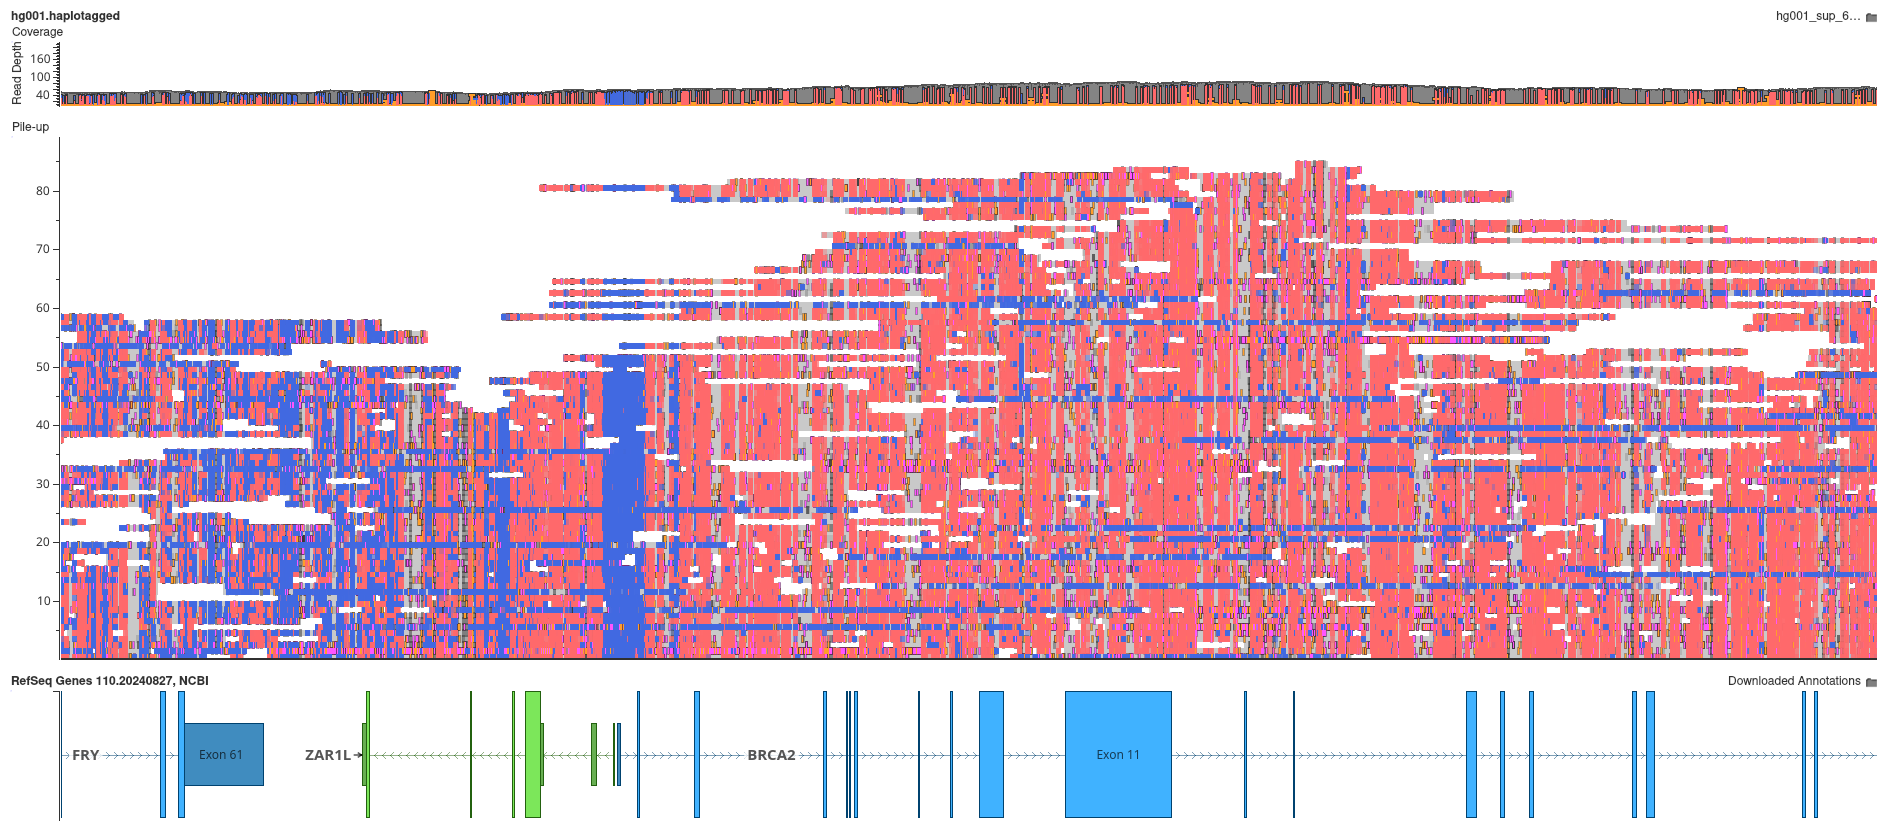
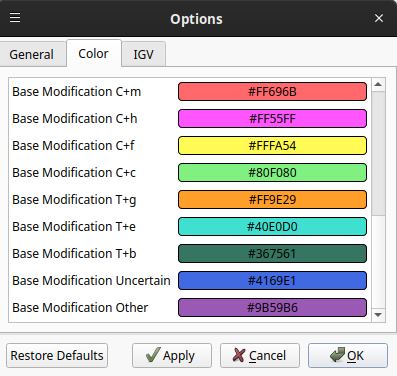
This approach creates intuitive visualizations where strong signals stand out clearly, while uncertain calls remain visible but de-emphasized. Other base modification types have different associated modification colors, which can be customized by clicking on the Options (⚙) icon.
GenomeBrowse provides three base modification coloring modes:
- Base Modification (All): Visualize all detected base modifications, regardless of type
- Base Modification (C+m): Only display 5-Methylcytosine modifications
- Base Modification (C+h): Only display 5-Hydroxymethylcytosine modifications
Conclusion
This new feature transforms complex base modification data into intuitive, color-coded visualizations, allowing users to quickly identify critical base modifications like DNA methylation and assess the confidence of each modification at a glance. By integrating this information directly into the alignment plot, GenomeBrowse empowers researchers to explore epigenetic modifications with greater clarity. Don’t hesitate to reach out to our team if you would like to try out our software and experience these features first hand.