This project contains two samples (NA12877 and NA12878) sequenced using the TruSight Cardio Sequencing Kit from Illumina. The VCF and BAM data for each sample is available for public download from the Illumina BaseSpace website.
The TruSight Cardio Kit uses next-generation sequencing (NGS) to provide coverage of 174 genes with known associations to 17 inherited cardiac conditions, including cardiomyopathies, arrhythmias, and aortopathies. Genes were selected by researchers at the National Heart and Lung Institute at Imperial College London. Content includes well-established genes for heart diseases that run in families and emerging genes from the literature.
Initial Workflow Summary
The VCF files were imported using the Individual Import option, with both samples set as affected and matched to their corresponding BAM files. Only variants in the PASS, IndelConflict, and SiteConflict filter categories were imported, resulting in 961 total variants from the combined sources.
The variants were then annotated with the following sources:
- RefSeq Genes 105v2, NCBI
- ClinVar 2016-06-02, NCBI
- NHLBI ESP6500SI-V2-SSA137 Exomes Variant Frequencies 0.0.30, GHI
- ExAC Variant Frequencies 0.3, BROAD
- dbNSFP Functional Predictions and Scores 3.0, GHI
Genotype Zygosity was calculated and the Coverage Statistics algorithm was run using a sorted version of the trusight_cardio_manifest_a.bed file from Illumina.
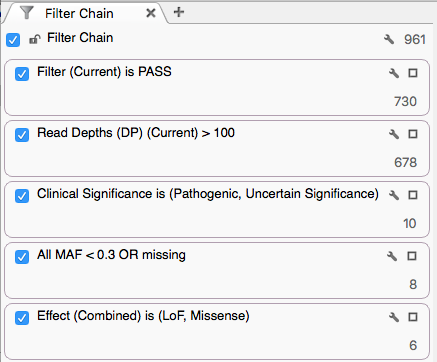
The variants were then filtered with:
- Sample Filter field contains PASS
- Sample Read Depth (DP) > 100
- ClinVar Clinical Significance defined as Pathogenic or Uncertain Significance
- NHLBI All MAF < 0.3 or missing
- Variants classified as Loss of Function or Missense per RefSeq
Investigating a Specific Result
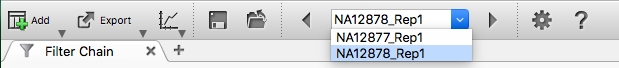
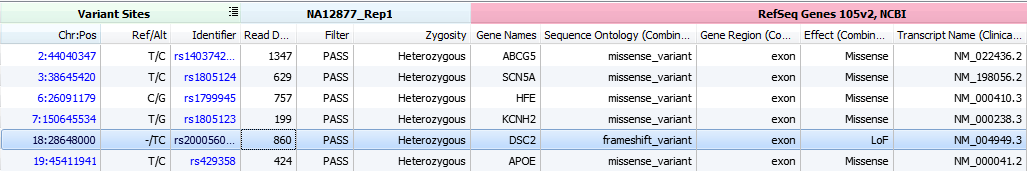
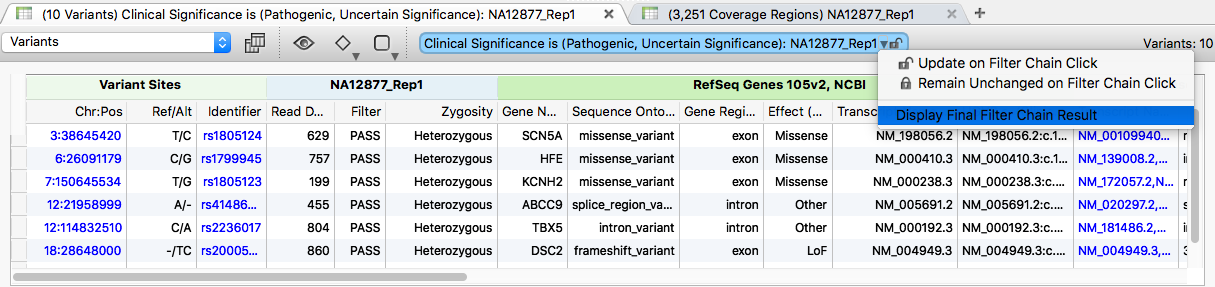
With this filter chain, 6 variants were identified for sample NA12877 and 3 variants for sample NA12878. Use the sample selection dropdown and arrows at the top left of the VarSeq window to scroll between sets.
From the 6 variants of interest for sample NA12877, take a closer look at the frameshift variant at 18:28648000 classified as Loss of Function (LoF).
Clicking the row in the variant table opens full annotation information in the Details View.
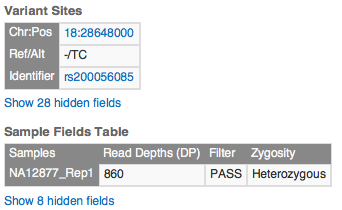
Scrolling the Details pane reveals Transcript and ClinVar annotations for this variant.
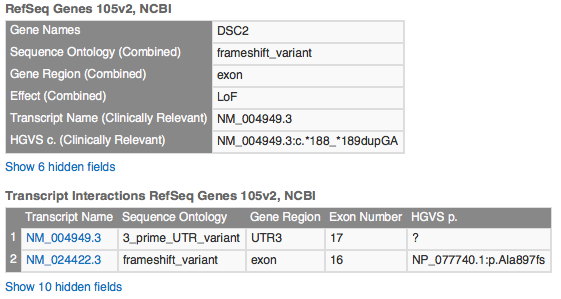
This variant overlaps multiple transcripts. In one, it sits in an exon region; in another, it falls in a UTR3 region. Transcript NM_004949.3 is the clinically relevant (canonical) transcript and is the one where the variant lands in the UTR3 region.
Under ClinVar, you will see 15 matches for this variant, most with a clinical significance of Benign. The record our filter chain selected is the first one listed, with significance Uncertain Significance.
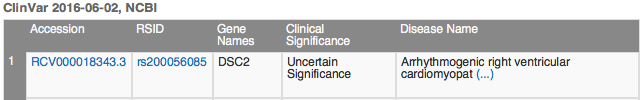
Click the hyperlink for the ClinVar Accession number RCV000018343.3 and the ClinVar record opens in the VarSeq Web Browser view. Scroll to the bottom of the ClinVar record and click the Evidence tab.
The paper "The p.A897KfsX4 frameshift variation in desmocollin-2 is not a causative mutation in arrhythmogenic right ventricular cardiomyopathy" confirms the status of this variant. The p-dot notation in the title is for the secondary transcript, not the clinically relevant one.
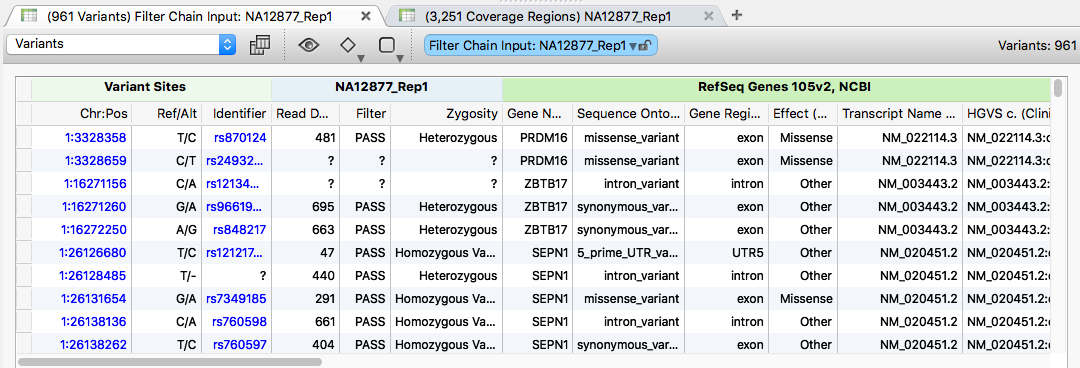
Looking at Coverage Statistics
To examine the coverage of imported variants, click the (3,251 Coverage Regions) table.
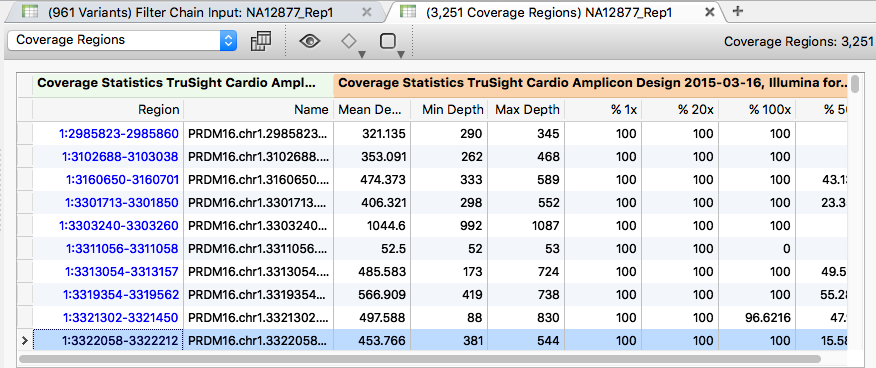
Sort the table by the "Min depth" field in ascending order. Right-click the "Min depth" column title and choose Sort Ascending. Several regions in the BAM files show low coverage.
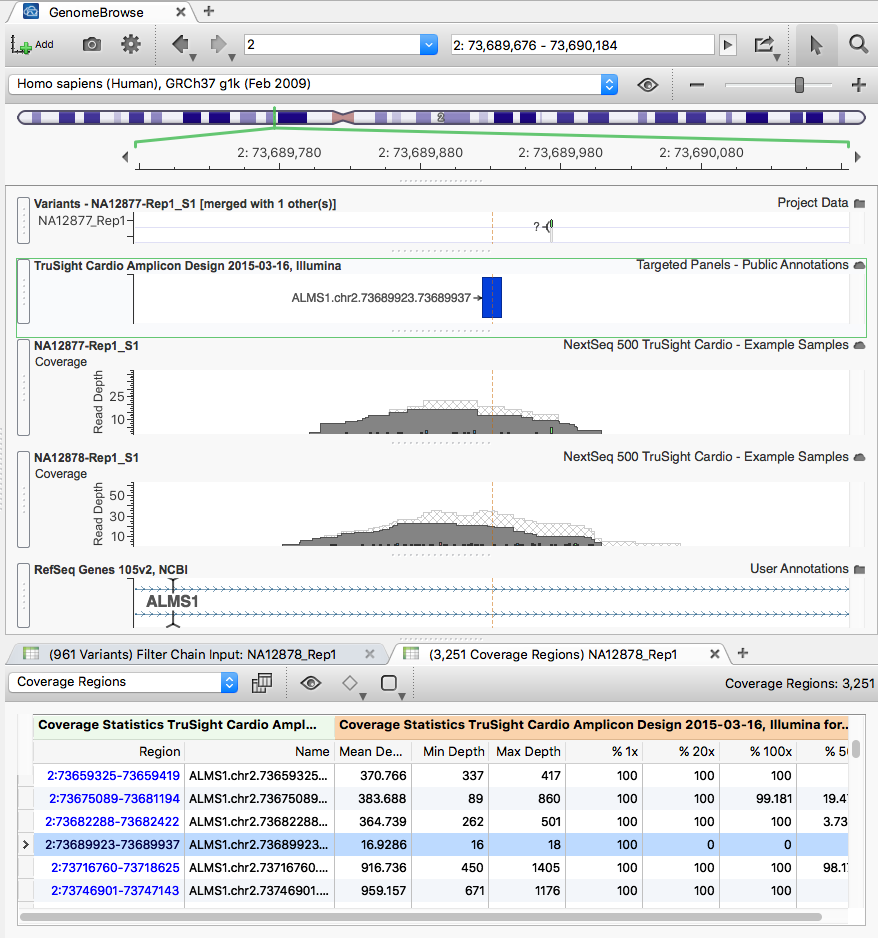
Clicking through rows of the Coverage Region table zooms the GenomeBrowse view (with each sample's BAM) to those regions.
Variants Classified as Pathogenic by ClinVar
On the filter chain, expand the Clinical Significance card by clicking the box in the upper-right corner to view all ClinVar annotations for the imported variants. Click the "3" next to the Pathogenic category.
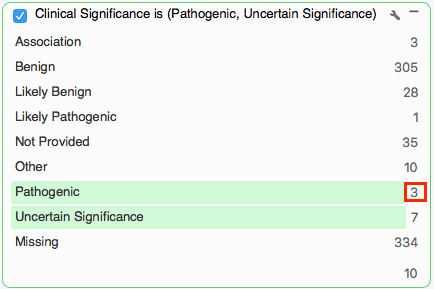
The table now shows only those 3 variants from the 678 that passed the read depth filter and are identified as Pathogenic by ClinVar.
Variant 7:150648198 is the only variant that did not pass the subsequent filters. It is classified as a synonymous_variant, so its Effect column shows Other. Scrolling right, the NHLBI frequency data shows an MAF over the required threshold of 0.3.
Restore the original results by selecting "Display Final Filter Chain Results" from the dropdown above the variant table.
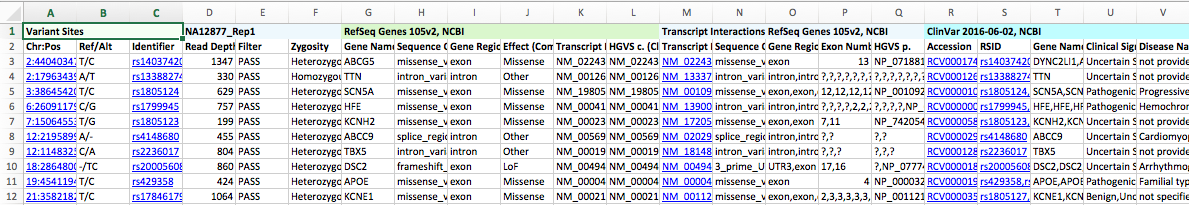
Exporting Variant Data
With the final filter results in the variant table view, you can export in several formats from the Export button on the main VarSeq toolbar.
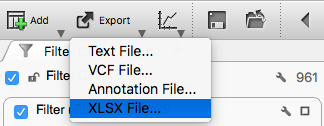
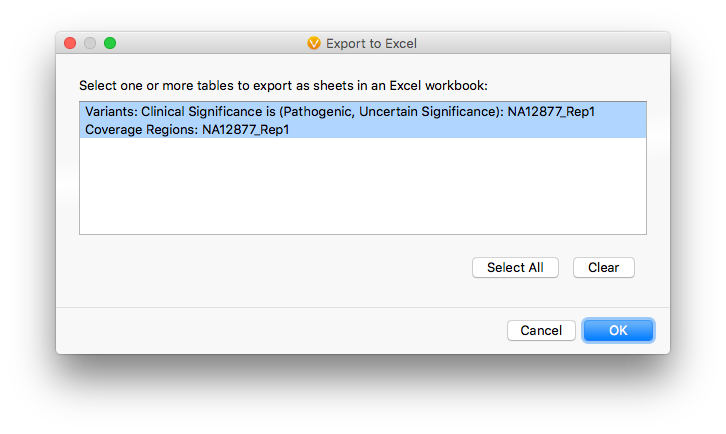
Selecting XLSX opens the multi-table export dialog, where you can pick any, some, or all of the active tabs in the project. Leave the defaults and click OK.
The next dialog selects which fields to include. Visible fields are checked by default. Leave the defaults and click Export. The result is a single Excel file with each active table on its own tab, with all hyperlinks preserved.