
Configuring a bioinformatic pipeline to reliably process genomic data — particularly at the tertiary analysis stage — is no small task. Doing so in an efficient, consistent way is an even grander challenge. Luckily, the VarSeq software suite provides a comprehensive toolbox for automation and integration. One of the first questions a new VarSeq user might ask is where processed data needs to end up. The versatility of VarSeq means that there really isn’t a wrong answer to that question.
With a bit of custom scripting, VarSeq can integrate with any LIMS that hosts an API and produce virtually any file type, supporting everything from routine clinical reporting to fully bespoke data exports. Today, we’ll go through the basics of interfacing with VarSeq’s custom scripting options and present some examples and starting points for exporting different file types.
While there are options to import, export, and manipulate data within the basic VarSeq GUI, VSClinical is the most user-friendly and customizable point of ingress for diverse data exports. In particular, for users looking to manipulate and export data that already exists within VSClinical, the VSClinical report tab is the best place to start. Navigating here and selecting “New Custom Script” from the “Report Exports” sidebar will allow us to reference existing custom export scripts and create our own (Figure 1).
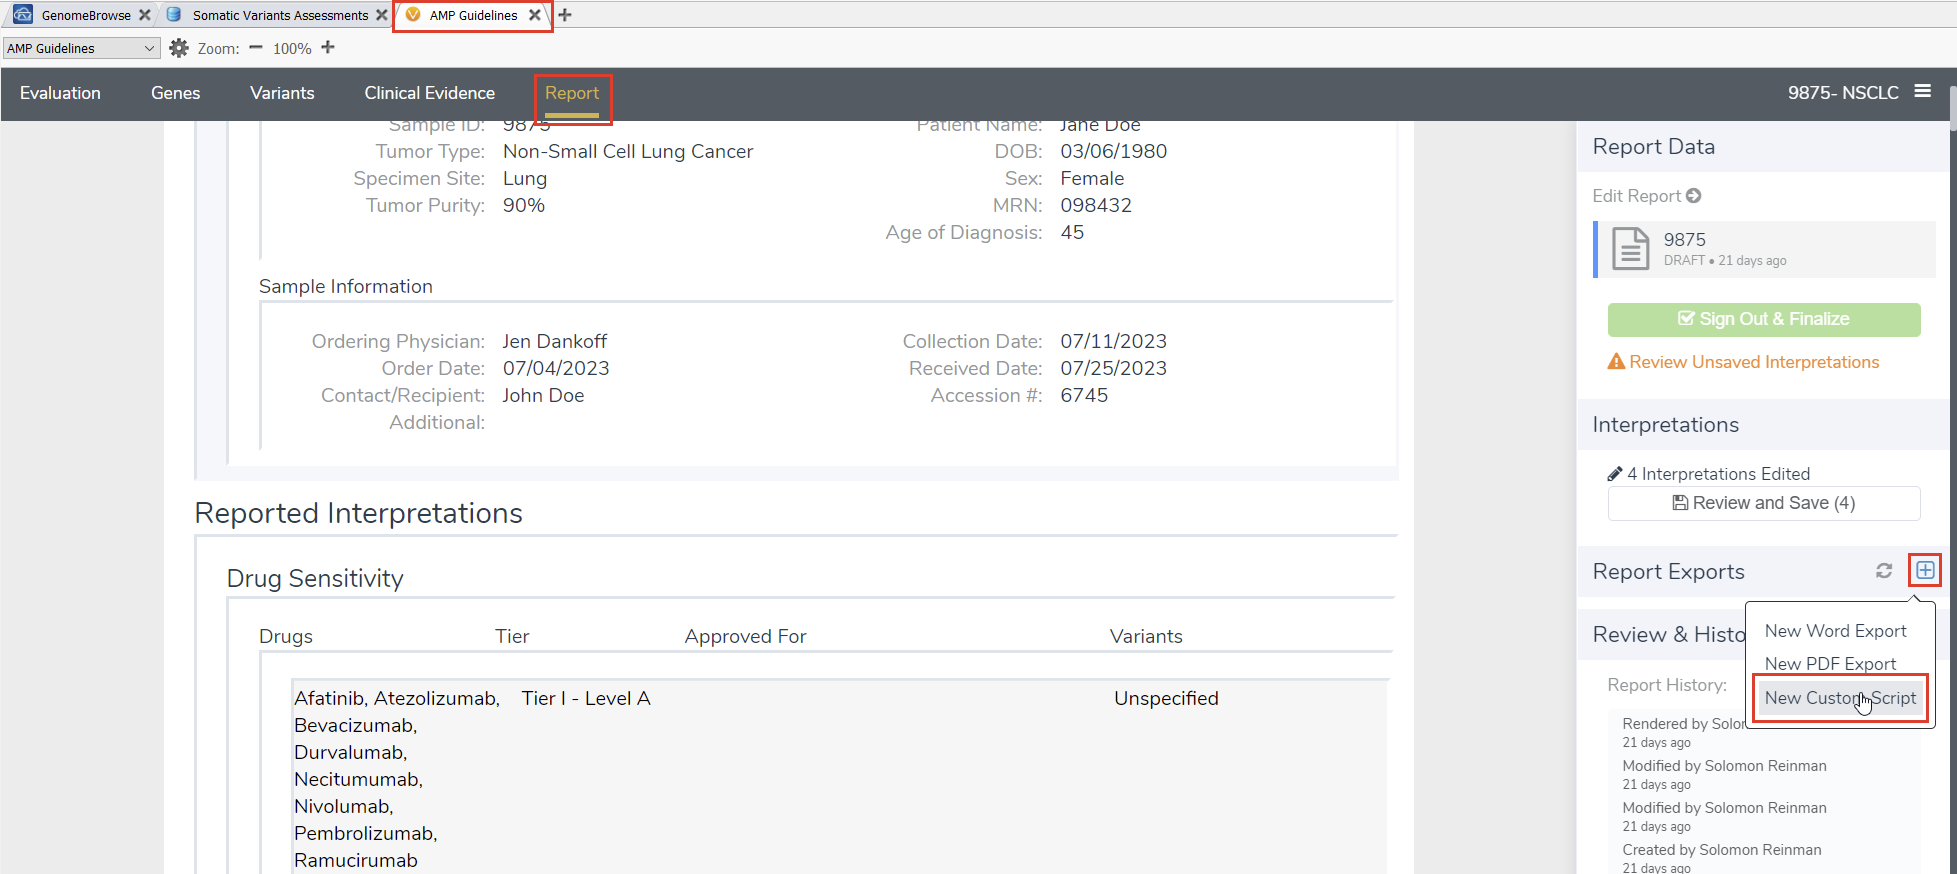
The custom script report option allows us to use JavaScript to interface with the data available behind the scenes in VSClinical. The most useful tools here are the existing JSON file we can use to explore the available data, the existing report templates which can give us an excellent starting point for developing custom exports, and the built-in debugger that allows us to use Visual Studios Code to test and expand upon existing code. We’ll use a VCF export example to explore each of these features.
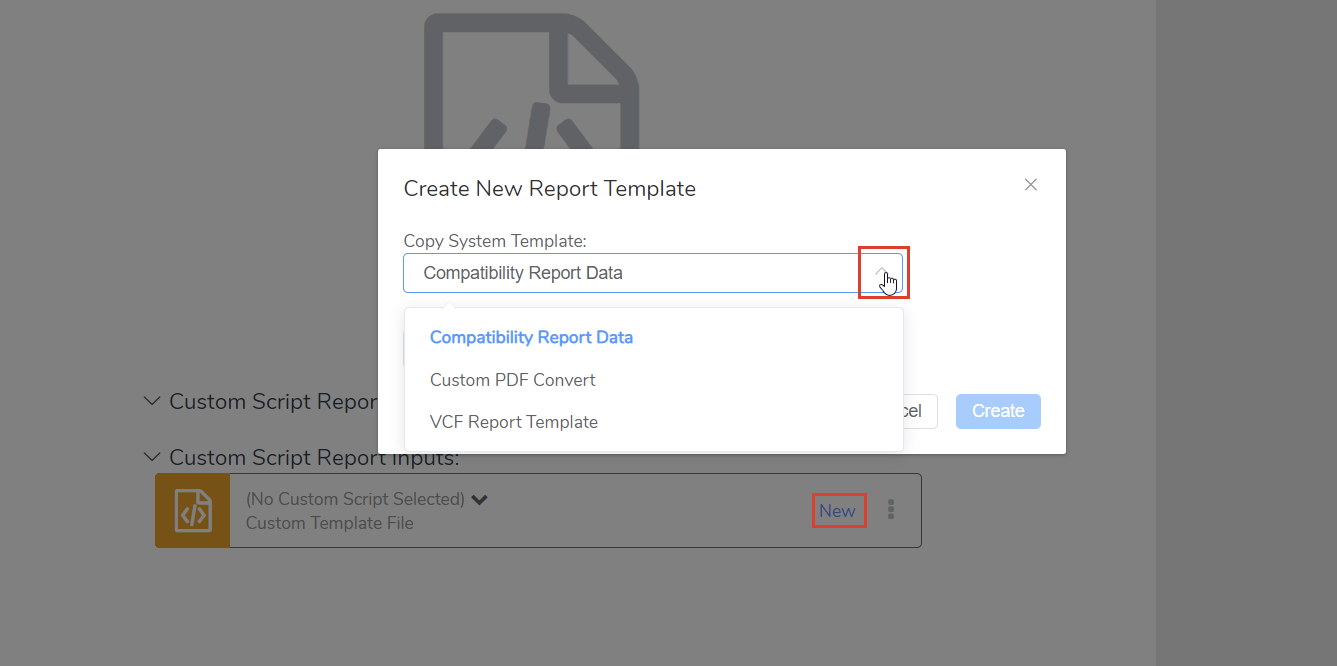
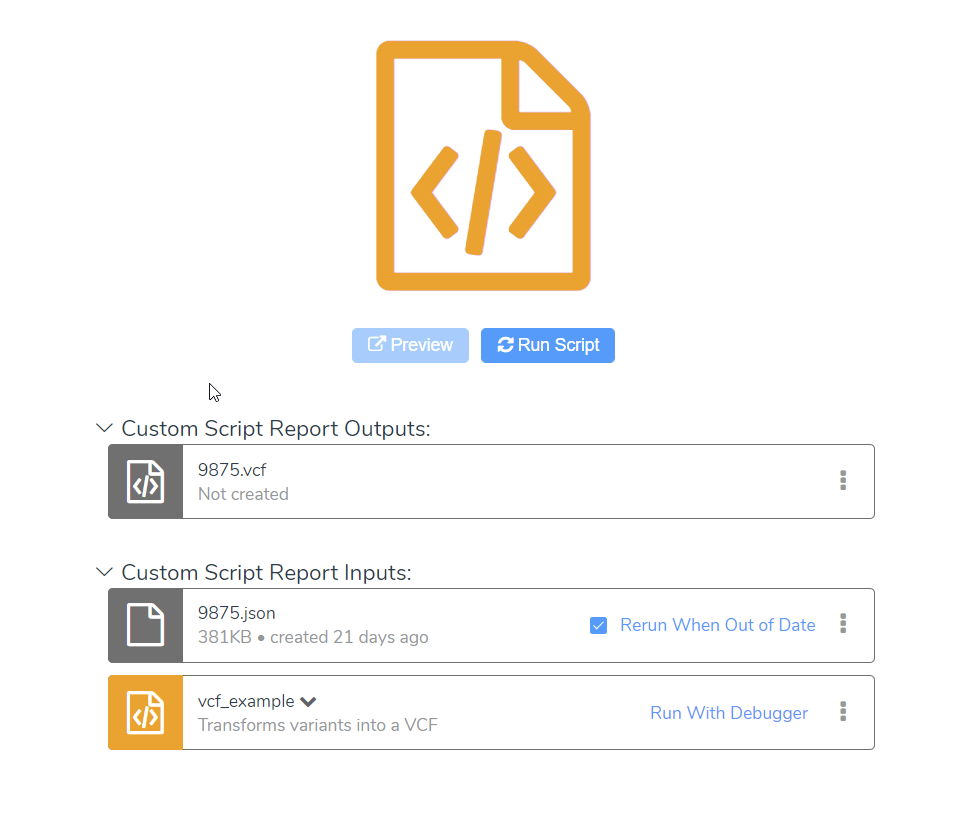
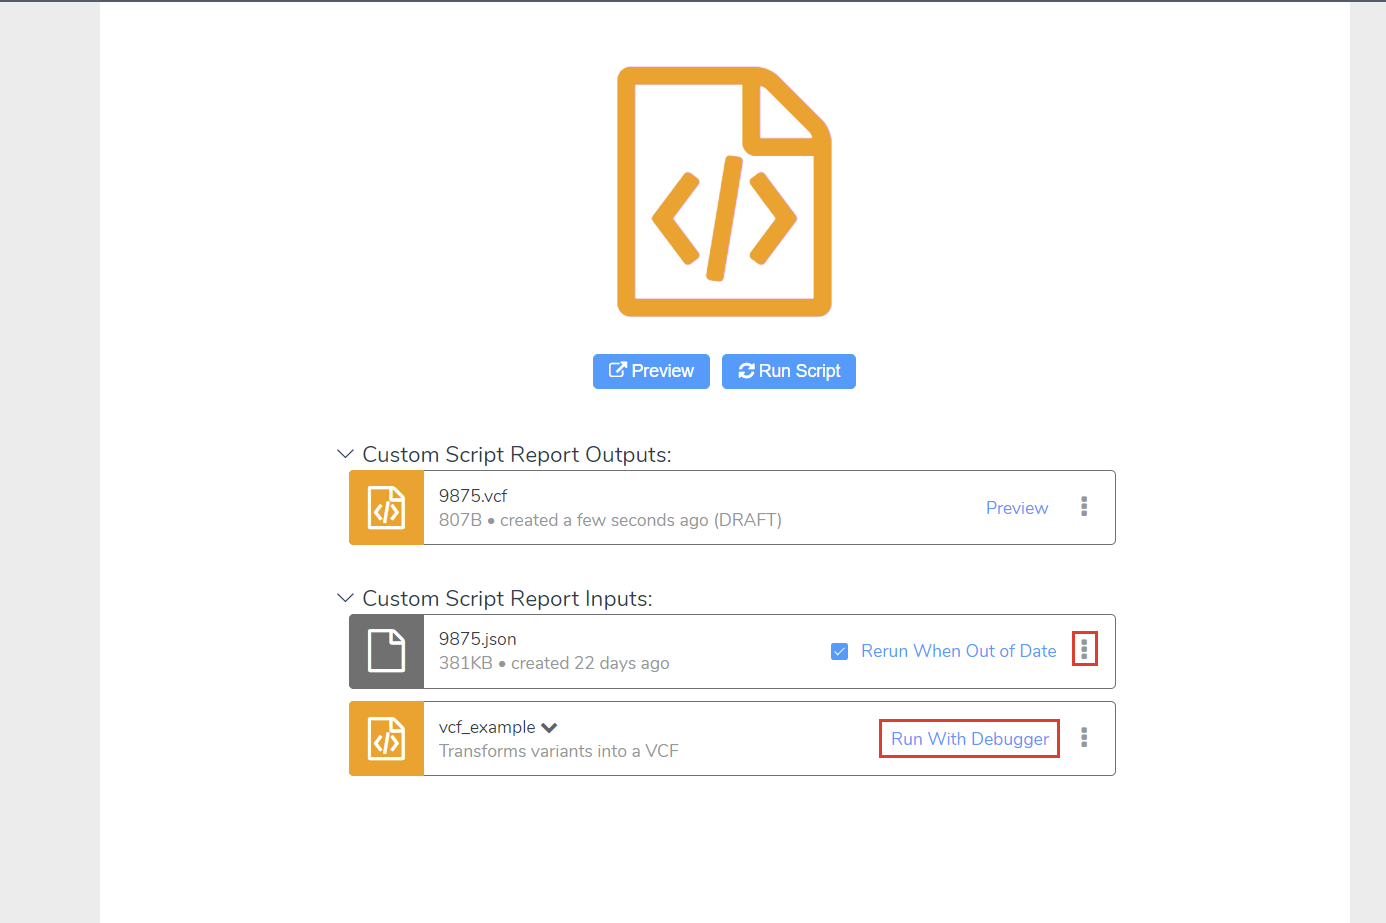
Once we’ve selected “New Custom Script,” we can choose “New” and select from a few existing system templates. Choosing the “VCF Report Template” here will give us a good starting point (Figure 2). If you’re following along, you can give your copied template a recognizable name and click “Create”. This will create a new folder containing the JavaScript code from the template we copied. The code stored in this folder can be executed by selecting “Run Script.” The input and output are defined by the custom script, which we will see in a moment. In this case, we can see that the inputs are the script itself and the JSON file for this sample, while the output is a VCF file (Figure 3).
Let’s investigate the anatomy of this custom report script a little further. Selecting the ellipse to the right of the vcf_example rectangle allows us to open the location of this script. We can then right-click and open the directory with VSCode. In this case, we’re looking at a VSClincal AMP project, so we can peruse the report_cancer.js file (Figure 4). While the file itself is relatively short, it still may be a little overwhelming at first, so let’s parse things out piece by piece.
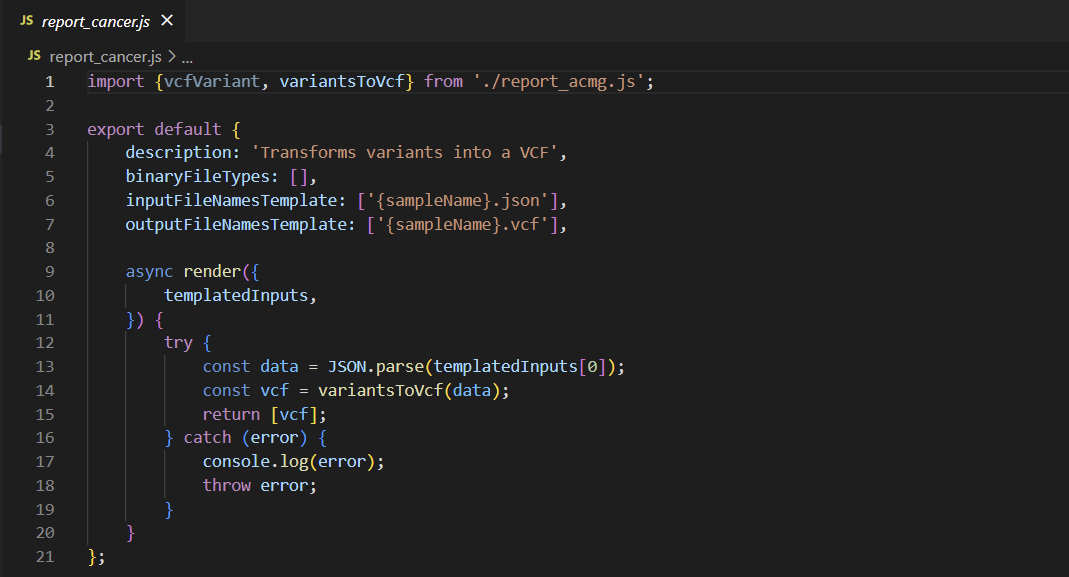
First, let’s look at the components that should be constant across all custom scripts. In general, we’ll have a JSON that contains a description, the input and output files, and the code that’s executed. While this may not be the most robust snippet of code ever written, the way errors are logged to VarSeq means that throwing everything in a try-catch block is good practice in this context. Any errors encountered during execution outside of the debugger will be printed with the full stack trace to the VSClinical console, so users can quickly debug simple problems.
For more complex errors and development of new scripts, let’s take a look at the debugger and the JSON file we use to pull data from VSClinical. Clicking “Run Script” with this example will automatically generate an updated JSON, which we can open with VSCode by selecting the vertical ellipsis in the JSON’s rectangle. Next, within VSCode we can attach the debugger by clicking “Run With Debugger” next to our script and navigating to our VSCode window where we have our report_cancer.js file open (Figure 5).
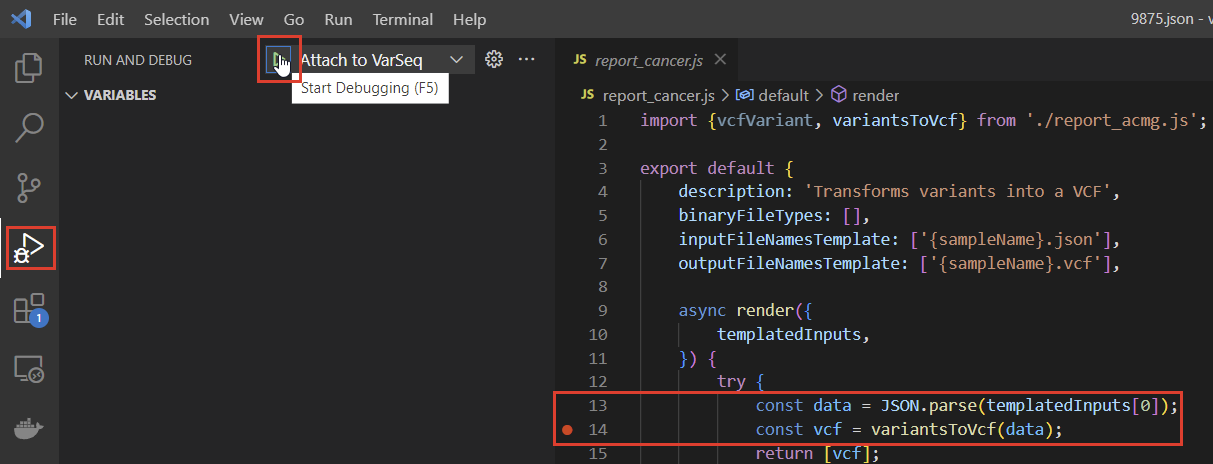
To attach the debugger, we can use the navigation bar on the left side of the VSCode window and select “Start Debugging” with “Attach to VarSeq” specified. We can set breakpoints wherever we’d like in the script, but for this example, let’s set one after instantiating the data constant and explore that (Figure 6). The JavaScript environment is configured to pass the evaluation JSON at templatedInputs, so we’ll be able to explore the JSON data we have available in the data constant.
Either using the debugger or inspecting the input JSON file itself, we can explore all of the fields available from our VSClinical evaluation. We can then manipulate that data and export it as whatever file type we’d like, either by writing to a local file or making an API. With these tools at your fingertips, creating an integrated, consistent genomic analysis pipeline is far more attainable — a key goal of modern NGS analysis software.
Want to learn more? Contact our team today!