My work in the GHI analytical services department gives me the opportunity to handle data from a variety of sources. I have learned over time that every genotyping platform has its own personality. Every time we get data from a new chip, I tend to learn something new about the quirks of genotyping technology. I usually discover these quirks the hard way, while troubleshooting an unusual pattern in the final analysis results. The good thing is that we can all learn from such experiences and know what to watch out for the next time. Quite often, I find something that I believe will be a property of just one particular array, but discover later on that other arrays have something similar.
In this post, I would like to discuss one such issue that has been weighing heavily on my mind in recent months: segmental duplications.
I was excited recently to have the opportunity to analyze data from the Illumina Omni2.5 chip for the first time in an applied setting. This particular project had a relatively small sample size, but still had enough data to give a good idea about the overall array performance. I started by going through a standard battery of SNP quality assurance (QA) metrics and found nothing at all unusual — the genotype data appeared to be excellent. But I couldn’t stop there.
Alert followers of this blog may recall a cautionary statement I made previously about working with Illumina CNV data — that males and females sometimes have different baseline signal intensity levels (this was more of a GenomeStudio software issue than a hardware problem). To find out if this issue affects the Omni2.5, I ran a simple t-test to compare the Log-R Ratio (LR) intensity values between males and females across the genome. The results are shown in the Manhattan Plot below.

Let’s talk about this plot. The huge signals in the sex chromosomes are of course expected. I was relieved to see that the Omni2.5 doesn’t seem to have the same gender difference that we have seen on some arrays — if present, we would see elevated association signals distributed uniformly across the autosomes. But there is something else here that bothers me. There appears to be several small regions where there is a major intensity difference between males and females. I have seen this before, and it usually has a simple explanation: segmental duplications of the sex chromosomes appearing in autosomal sequence. I discussed this phenomenon briefly in a previous blog. As I pointed out in that post, the array manufacturers do a lot of careful probe design work to ensure unique sequence identity. But anybody who has been involved in designing PCR primers, genotyping assays, short-read sequence alignment, or any of a number of related genomics tasks will tell you that it can be very difficult to find truly unique sequences. Non-specific binding is always a risk.
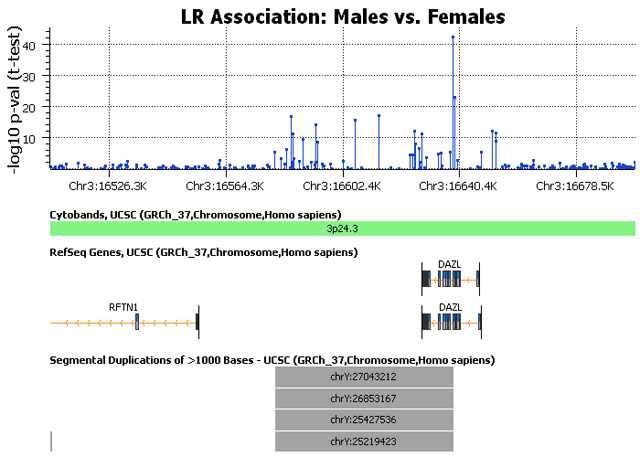
Upon seeing that segmental duplications might affect the Omni2.5, I decided to take a closer look to see what was really going on. The next image is a closer view of a signal peak on chromosome 3, together with an annotation track that specifies the location of known segmental duplications for this region.

We can see in this plot that the genomic region surrounding this signal peak has high homology to at least 4 different segments on chromosome Y. (The annotation track includes any locus with at least 90% sequence similarity.) I scanned through the largest peaks in the test results and found this pattern was very common. A few of the peaks did not have any annotated segmental duplications, but the majority had a Y-chromosome duplication. This has obvious ramifications for CNV analysis, as there is potential for males to have false copy gain calls in these regions if the probes are unexpectedly binding to the Y chromosome. But what does it mean for SNP analysis? Can the SNP genotype calls be affected?
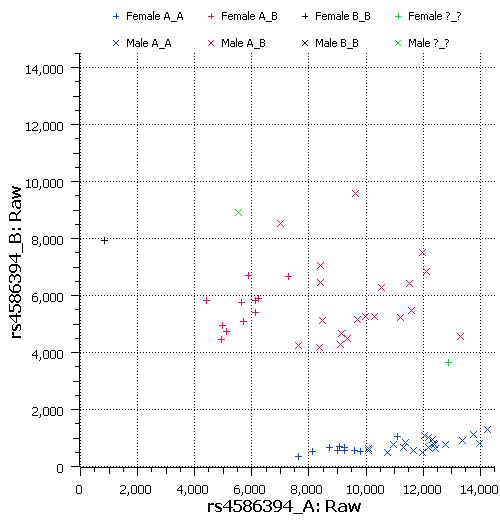
To find out, let’s take a look at the raw allele signal data. The following plot shows the raw signals for the “A” and “B” alleles for rs4586394. This SNP is visible in the above Manhattan plot as the largest signal on chromosome 15 (p=5.9e-25). I selected it arbitrarily, as it had the highest minor allele frequency among SNPs with strong LR-gender associations. This SNP falls within three segmental duplications as annotated by UCSC: one is a nearby area of chromosome 15; the other two are on chromosome Y.

In this plot, the raw “A” allele intensity is plotted on the horizontal axis, and the “B” allele intensity is plotted on the vertical axis. From the raw signals, we can clearly see that males are shifted to the right compared to females. This suggests that males have a stronger signal than females for the A allele only, which indicates that perhaps only the A allele probe is affected by binding to the Y chromosome. But it’s not really clear from this plot if the genotype calls are adversely affected. The heterozygous genotype cluster is not as tight as I would like it to be, but I’ve seen worse.
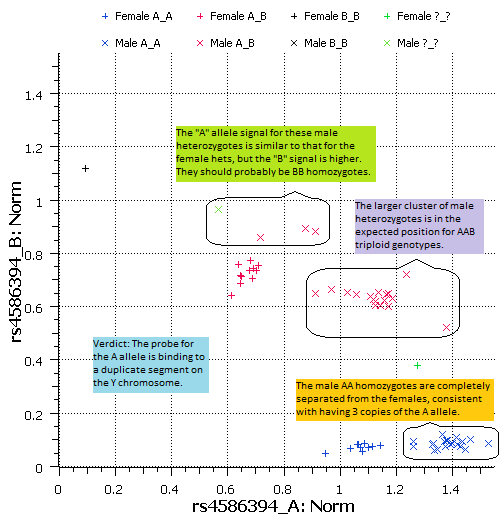
The raw signal cluster plot wasn’t really conclusive, but GenomeStudio makes genotype calls based on normalized signals, so let’s take a look at the normalized data in the next plot.

When we examine the normalized signal data, it appears that males and females each form 3 distinct clusters, corresponding to the 3 possible genotype categories. The position of the male clusters relative to the female clusters is consistent with how the clusters would appear if the males all had three copies of this genomic segment. Given the evidence that the A allele probe is binding to chromosome Y, it essentially is a triploid system.
The result is that 3 subjects (out of about 95) appear to have incorrect genotype calls, as noted in the plot. The one male no-call should probably be a BB homozygote. The one female no-call is a sample that was discovered during QA to be contaminated by a second DNA sample. The unusual position of that point in the plot indicates that the two subjects contributing to that sample probably have AA and AB genotypes. I should note that all of the genotypes, LRs and allele signals shown here were generated with default methods in GenomeStudio and exported to Golden Helix SVS for analysis and visualization.
Now I’d like to address a few questions:
1. How does something like this happen?
In the hg19 human genome assembly, the reference allele for rs4586394 is G, and the alternate is A. The Y-chromosome duplications annotated by UCSC have sequence similarity of about 95%, so it’s not a perfect match. On the Omni2.5, the “B” allele corresponds to the reference allele “G.” It appears that the reference allele probe sequence is unique and binds only to the specified locus on chromosome 15. But the probe for the alternate allele, with one base difference, matches with Y-chromosome segments as well.
2. How big of a problem is it?
I have no way to know, but I expect that it is fairly isolated. There are a lot of other Y-chromosome duplications that don’t have any problems. The SNP shown in the example is the only one that I have closely examined so far. Based on the Manhattan plots, it looks like perhaps a few hundred SNPs out of 2.5 million may be affected by duplications on the sex chromosomes. I do not know whether any SNPs are adversely affected by segmental duplications involving other autosomes.
3. How can I be sure that my analysis isn’t affected by segmental duplications?
Segmental duplications are more problematic for CNV analysis than for SNP analysis, but the example above shows how SNPs can also be affected. The most conservative course of action would be to identify and remove any SNPs from segmental duplications prior to analysis, but I think that would be excessive. The table in my earlier post shows that you might lose over 4% of your SNPs by doing that, most of which won’t have problems with non-specific binding. The more pragmatic approach, as always, is to use good study design principles and to be vigilant in your QA efforts.
In my example with rs4586394, there is an apparent bias toward calling the A allele in males, and it is likely that this SNP would have failed HWE screening if my sample size was larger. In this case, the HWE p-value was 0.01, which would not draw any attention in a GWAS. The poor signal clustering might also lead to low call rates in some cohorts. That SNP probably wouldn’t confound my test results unless there was a gender bias in the phenotype, which emphasizes the importance of knowing the biases in a study and appropriately controlling for them. Ultimately, the most important thing you can do in any study is to carefully examine significant results for technical artifacts such as segmental duplications before publishing.
… And that’s my 2 SNPs.
Great post Bryce! Would you be able to provide more details on how one would access and use the segmental duplications annotation track you’re referencing? Did you create it yourself? Is it available on data.goldenhelix.com? Thanks!
I created the segmental duplications track myself, based on the “genomicSuperDups” table from the USCS table browser. A similar annotation track should be available soon for SVS users to download from the Golden Helix data server.
Thank you for sharing this wonderful article. It is interesting and informative.