Large genetic cohorts require substantial effort to analyze. Genetic researchers are increasingly turning to whole exome and whole genome sequencing analyses for their clinical diagnostics and research. However, with that approach comes the challenge of making sense of these massive datasets. This is especially challenging when looking for tools that can streamline variant analysis for large genetic cohorts and include considerations for cases and controls while also considering multiple variant types that fall into the categories of coding and non-coding variants. VarSeq is a multifunctional tool for variant analysis that is versatile enough to cover all these bases.
In this article, we will do a brief overview of variant filtration for a whole exome cohort where the cases are affected by the disorder Kleefstra syndrome. Unlike a sample-specific project, we rely less on variant quality filters when doing a cohort-based analysis. Fields such as the read depth, genotype quality, and variant allele frequency that are derived from the VCF are going to be sample specific. The cohort filtering strategy is designed to consider variants across all samples without being limited by the quality of variants in any specific sample, whereas a sample-specific variant filtering strategy is designed to identify high-quality variants in each specific sample. Nevertheless, variant quality is still important in both cases. One way to leverage the variant quality parameters in a cohort analysis would be to pre-filter all the samples in the cohort based on variant quality and then import the filtered VCFs and apply a cohort-specific filter strategy.
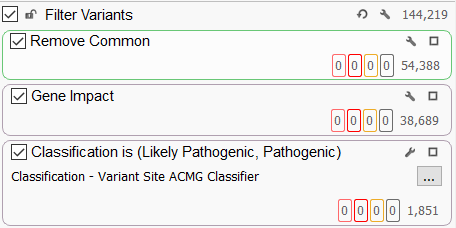
A typical filtering strategy (Figure 1) for large genetic cohorts is to remove the common variants in the population and focus on the impact of these variants. Gene impact filters will identify variants that impact protein coding by looking for missense and loss of function variants or variants that affect mRNA splicing OR identify variants that fall into the non-coding regions of the genome. A recent blog on the topic of predicting the functional impact of genetic variants using VarSeq can be found here. The variants can be further restricted to those that have a particular ACMG classification (usually pathogenic or likely pathogenic for large genetic cohorts). For a cohort-based analysis, we use the Variant Site ACMG classifier, which is not sample-specific. This will allow us to have a big-picture view of the ACMG classification of all variants in the cohort, regardless of whether the particular sample being viewed has that variant or not.
Begin utilizing the automated ACMG variant classifier.
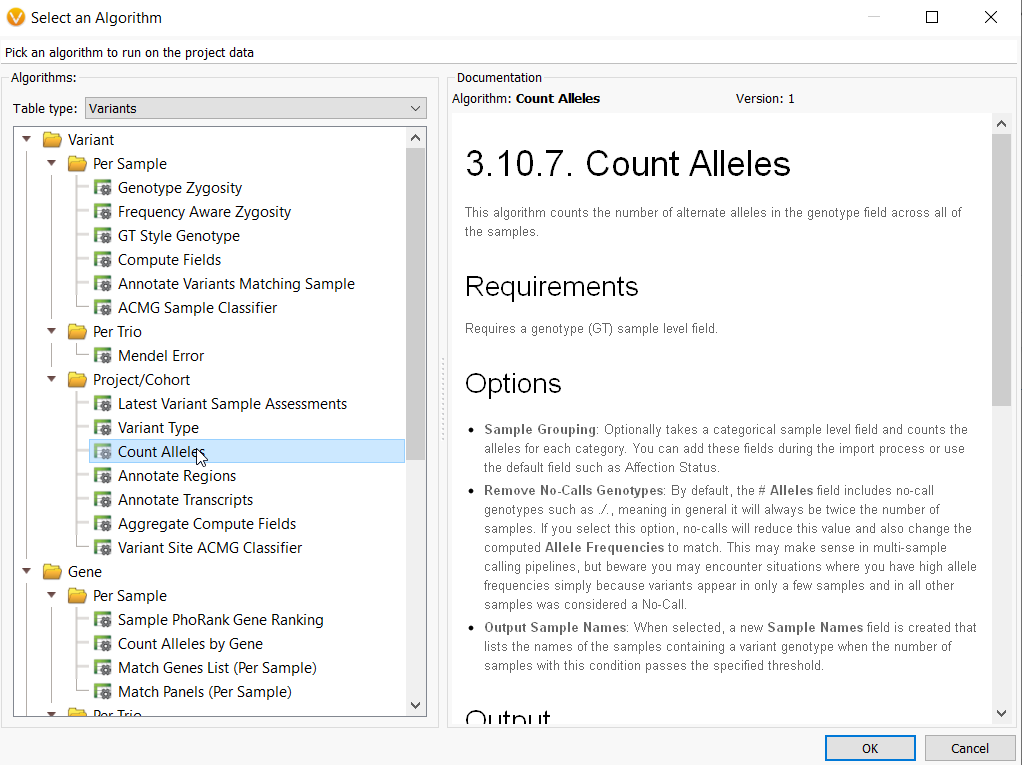
Beyond this, we then get into the cohort-specific analysis. One of our most powerful algorithms for a large genetic cohort is the Count Alleles algorithm (Figure 2). This algorithm captures the number of alternate alleles across all samples in a project based on the information in your genotype (G/T) field. With this feature, you can group samples according to their affection status, decide whether to remove no calls genotypes for large multi-sample calling pipelines and create comprehensive tables showing which samples in your large genetic cohort share a particular variant genotype.
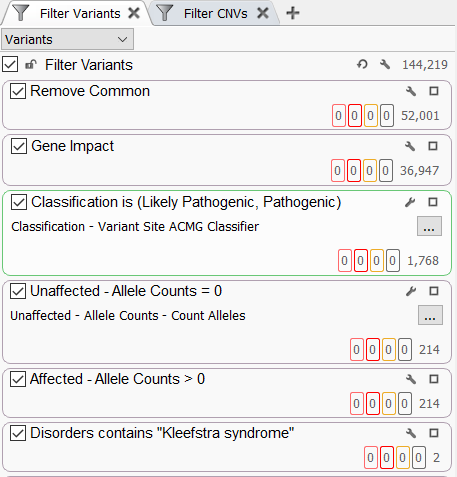
Once this algorithm is complete, you can use the allele counts in cases versus controls to identify the most relevant variants in your cohort. The output of the Count Alleles algorithm is shown below (Figure 3). The total number of alleles in the cohort for each variant is reported along with the allele frequency in the cohort. We also report the number of heterozygous and homozygous for each allele. Moreover, we report the number of samples in the cohort and the sample names in which each variant can be found. We also break down allele counts by affection status.

The “UnaffectedAlleleCounts” and “AffectedAlleleCounts” fields can be very useful in a filtering strategy to identify variants that may be contributing to a specific disorder in the affected cases (Figure 4). Adding these fields to the filter chain and setting the allele counts for the unaffected samples to 0 is a powerful way to focus on those variants that are only in your cases in a large genetic cohort. You may generally look at variants in your cases that are either in a heterozygous or homozygous state by setting the “AffectedAlleleCounts” to greater than 0. Coupling these filters with an OMIM-based disorder search has allowed us to identify 2 candidate variants for Kleefstra syndrome (Figure 4).
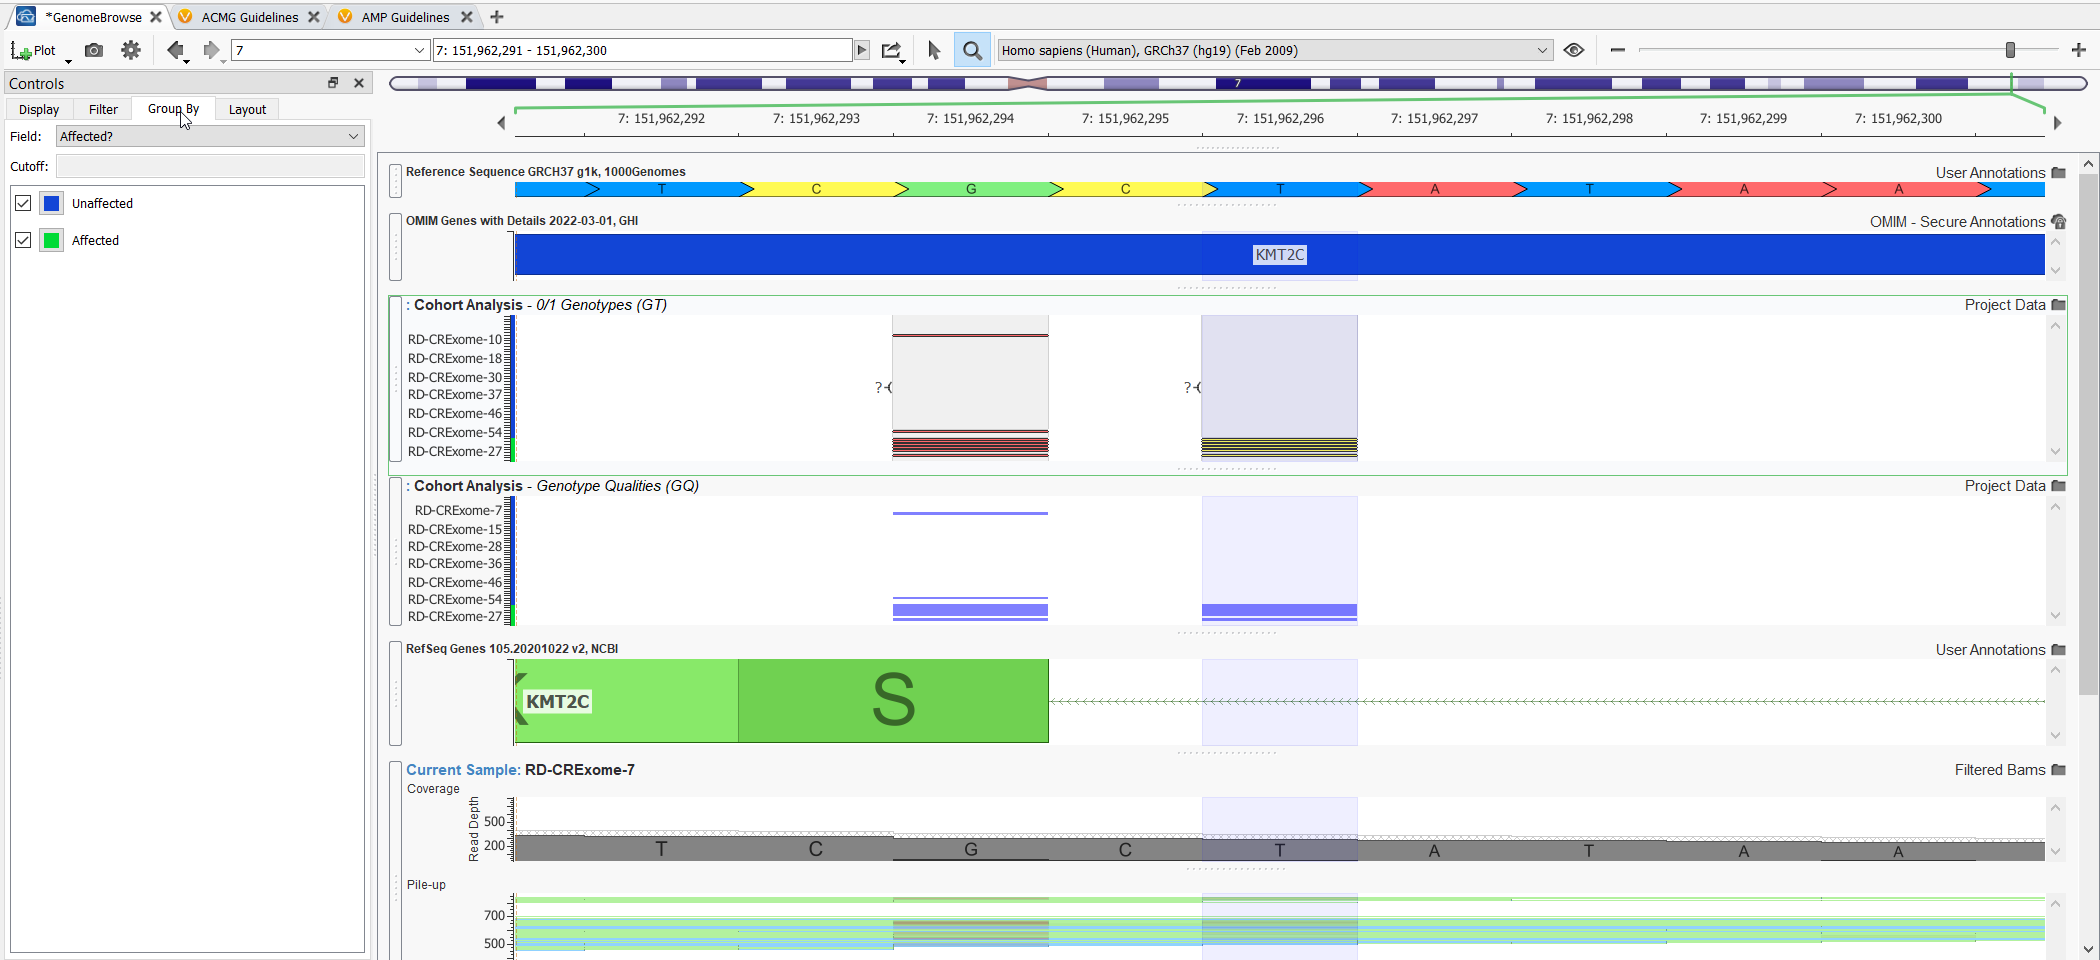
Genome Browse is also a very powerful visualization strategy for the variants in large genetic cohorts. You can plot variants for all samples and group them by affection status (Figure 5).
VarSeq offers very powerful filtration and visualization solutions for streamlining variant analysis of large genetic cohorts. In the next blog in the series on this topic, we will discuss other powerful VarSeq features for tracking alternate allele frequencies across cohorts in multiple projects.
Golden Helix has developed innovative tools for the genomic interpretation of variants based on the ACMG guidelines. The guided workflow enables following the ACMG guidelines used to identify and classify causal variants for inherited disease risk, cancer predisposition, and the diagnosis of rare diseases. This integration drives deeper analysis and accelerated interpretation with the benefit of manual inspection control.