VarSeq 2.2.2 has incorporated a multitude of interesting new features. In this blog, I want to continue discussing these features and how each can be incorporated into your workflow. I will also discuss the application of the Probability Segregation algorithm for copy number variation (CNV) analysis.
The Probability Segregation algorithm is a new algorithm that has been added to VarSeq in tandem with the new ACMG Sample CNV Classifier algorithm. The algorithm computes the expected copy number for each CNV that is called and identifies samples that are likely to share the CNV. This could be useful for cohort analysis, for example. However, the real value of the Probability Segregation algorithm comes into play for trio CNV analysis as the algorithm also computes the probability that the CNV is present in the mother or father, based on the expected copy number for each CNV that is called.
This algorithm can be added to your CNV table by choosing Add>>Computed Data>>AMG Sample CNV Classifier OR Copy Number Probability/Segregation.
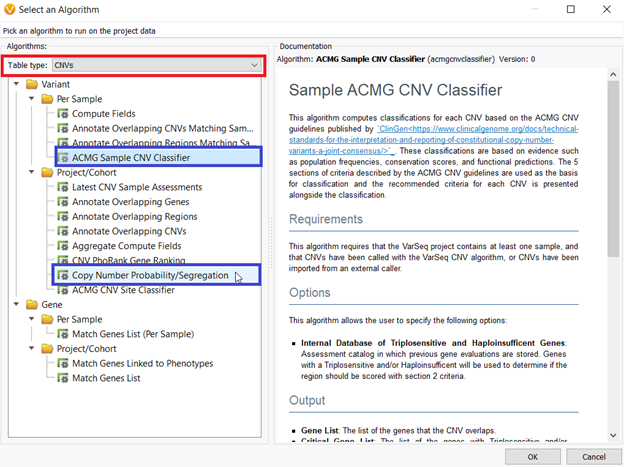
When the ACMG Sample CNV Classifier is selected, it adds the Probability Segregation algorithm to the project along with it. However, no matter which method you use to add the algorithm, after selected, a dialog will open asking the user to specify the Minimum Similarity Coefficient. This value by default is set to 0.75, however, by increasing the similarity coefficient close to 100, the CNV needs to be almost the same size, region, etc. to be considered inherited (Figure 2).

I have added the Probability Segregation algorithm to a trio project wherein the RD-CRExome-1 sample is the child, RD-CRExome-3 is the mother, and RD-CRExome 5 is the father. I want to discuss the outputs of the algorithm and how to interpret the output.
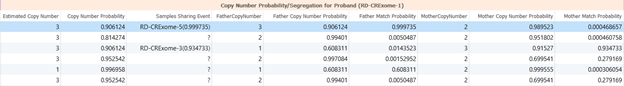
Figure 3 shows the output of the Probability Segregation algorithm which will essentially tell you the probability that a CNV is inherited. Remember that these computations are done for all CNVs called in the project and are not dependent on whether the CNV was called for that sample. The estimated copy number column is the estimated copy for the current sample (the child). A 2 indicates a diploid region, a 1 (or less) would indicate a loss, and a 3 (or more) would indicate a duplication. The copy number probability column beside it refers to the confidence/probability that the estimated copy number is accurate. Then the same probabilities are calculated for each parent. The final columns (Father/Mother Match Probability) will tell you how similar those copy numbers are to the child.
In the blue highlighted row in Figure 3, the child is expected to have a duplication in the region along with the father with high confidence indicated by the estimated copy number and copy number probability columns, respectively. However, the mother has an estimated copy number of 2, meaning she is diploid for this region with high confidence. The match probability is very low between the child and the mother as the mother is diploid in this region, and the child has a duplication. The match probability between the father and the child is very high at a 90% match, as they both have a duplication in the region.
It is always a good idea to plot the CNV state in GenomeBrowse along with the quality control metrics Z-score and ratio from the CNV caller to examine the CNVs further (Figure 4).
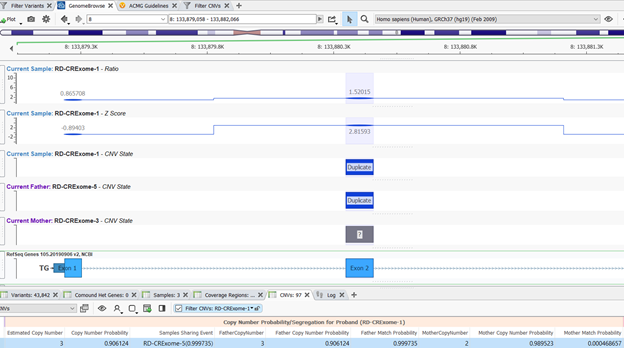
Taking a closer look at Figure 4, we can see that the duplication even in the child overlaps the duplication event in the father, but the mother is diploid. The z-score for this event in the child is around 3 and the ratio is around 1.5 which are both indicative values for a duplication event. In diploid regions, the Z-score is around 0 and the ratio is around 1. Based on this review, it is likely that this CNV event was inherited from the father.
Analyzing CNV inheritance is important for improving genetic diagnosis and causality for familial diseases, and the Probability Segregation algorithm offers a solution to improve tracking down such CNVs. There is an upcoming webinar on February 10th that will examine both CNV and SNV analysis in a trio workflow and applying the ACMG guidelines to these inherited SNVs and CNVs.
If you have any questions about integrating the Probability Segregation algorithm into your own workflow, or if you have questions on interpreting the output, please do not hesitate to reach out to the Field Application Scientist team at [email protected]! Feel free to also check out some of our other blogs that always contain important news and updates for the next-gen sequencing community.