One of the lesser known functions in SVS allows the user to create Venn diagrams comparing variants found in multiple spreadsheets. These different spreadsheets could come from individuals samples, a case vs. control group or several variant databases. It is a helpful tool for visually comparing different variants.
Start by creating spreadsheets for each group/samples you’d like to compare. The first example here is for a rare variant case/control study. The whole dataset is split into two spreadsheets, one for cases and another controls. This can be easily accomplished by right-clicking on the C/C column and selecting Activate by Category, then choose one category and click OK. The other group will turn gray and become inactive. Now you can do a row subset and have a new spreadsheet. You can repeat the process for the other group(s).
To compare just the homozygous alternate variants between the spreadsheets you need to deactivate the other types of variants. This is accomplished by clicking on the C/C phenotype column to turn it pink (the dependent variable), and then going to DNASeq> Activate Variants by Sample Genotype. This allows you to select just the homozygous alternate variants and click OK. This function works by comparing the variant’s columns in each spreadsheet, so you must deactivate the type of variants you don’t want counted. This same process can be repeated for the Ref/Ref, Ref/Alt or missing genotypes.
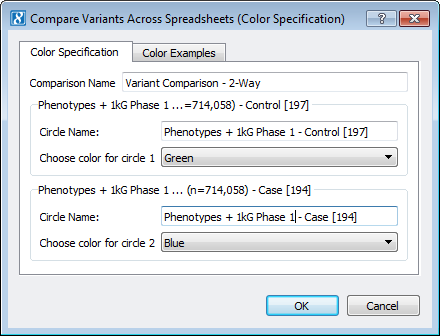
Now you can go to the Project Navigator Window and select Tools > Compare Variants Across Several Spreadsheets. This allows you to select the spreadsheets of the filtered variants for comparison and will automatically create a Venn diagram of comparisons. In the menu you can adjust the color and label for each section of the Venn diagram before it is generated, Figure 1 and 2.
Figure 1. Menu from Compare Variants Across Several Spreadsheets
Figure 2. Comparing homozygous alternate variants between C/C groups using the 1kg Phase 1 data.
Another example for comparing variants across individual samples works in a similar manner. If you want to see what is present vs. absent between the samples, open the genotype spreadsheet for each individual sample and go to DNA-Seq > Activate Variants by Sample Genotype and select all options except the missing genotypes (Ref/Alt, Alt/Alt, Ref/Ref).
Now from the Project Navigator window go to Tools > Compare Variants Across Spreadsheets. This allows you to select the spreadsheets that have been edited to remove missing variants. The example in Figure 3 is from a dataset from 5 Mice Strain Exomes. This same process can be repeated for alternate, heterozygous and reference variants, by selectively removing the others from the dataset of each sample.
Figure 3. Comparison of exonic variants from five mice strains, comparing presence/absence of variants.
Another common use for this function is comparing datasets of variants for different databases. Here are a couple blogs we have published previously on this topic:
- The State of Variant Annotation: A comparison of AnnoVar, snpEff and VEP
- The State of NGS Variant Calling: DON’T PANIC
If you have questions when using this or any other function in SVS, please email our Support Team at [email protected].


