The SNP and Variation Suite (SVS) software currently supports three methods for genomic prediction: Genomic Best Linear Unbiased Predictors (GBLUP), Bayes C and Bayes C-pi. We have discussed these methods extensively in previous blogs and webcast events. Although there are extensive applications for these methods, they are primarily used for trait selection in agricultural genetics. Each method can be used to create models that predict phenotypic traits based on genotype data. The model is trained on samples for whom phenotypic data is available, and then used to estimate the same phenotype for samples with unknown phenotypes. But how can you determine if the model is really accurate?
Cross-validation is a powerful method for assessing how well a prediction model may perform in an independent data set. Cross-validation allows you to test the predictive potential of baseline training data internally without biasing the prediction. The basic process is simple: randomly divide the data into several equal subsets, then iteratively create and test predictive models such that each of the subsets is withheld and used for model testing one time while the remaining subsets are used to train the model. This process is known as “K-fold cross-validation,” where “K” is the number of iterations used. Figure 1 is a schematic representation of 5-fold cross-validation. In this example, the complete training set is divided into 5 random subsets, and the model training and attesting process is repeated five times. In each iteration, one subset is used to test a prediction model that is trained on the other 4 subsets. Upon completion, the known phenotypes for the samples can be compared with the predictions to assess model performance.

Figure 1: Schematic representation of 5-fold cross-validation.
Prediction performance assessments made via k-fold cross-validation are a good estimate for how well a prediction model based on the complete data will perform when applied to external data. For the illustration in Figure 1, 5 different prediction models were developed, each using about 80% of the complete training set. If the cross-validation results show good performance, then you may proceed to create a final model using a similar method, but incorporating the complete data, and be confident in the performance of that model for application to another data set.
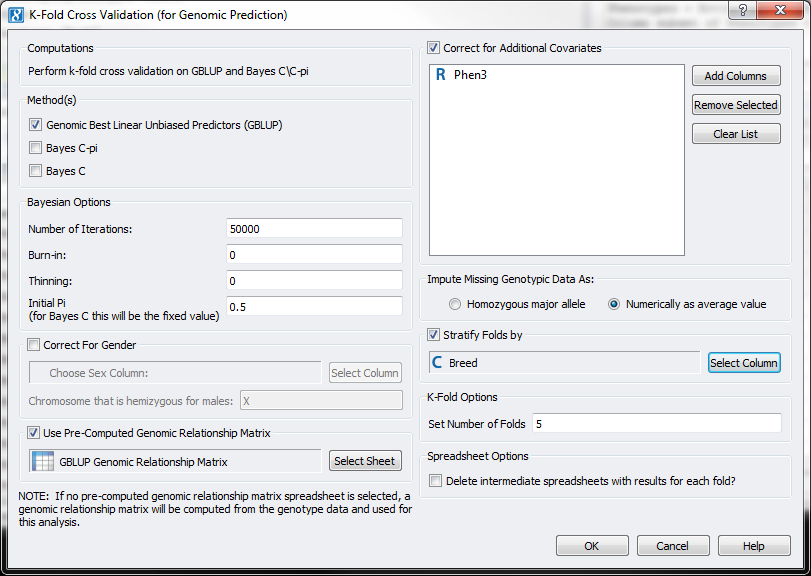
The latest release of SVS includes new functionality for K-fold Cross-Validation that can be used with GBLUP, Bayes C or Bayes C-pi. As seen in Figure 2, the function allows you to specify model covariates, prediction method options, the number of prediction iterations (or “folds”) and a stratification variable. By using the stratification variable, you can ensure that each of the random subsets has a proportional allocation of samples from various subgroups in the data. For example, if you stratify by gender in 5-fold cross-validation, each of the 5 random subsets of samples will have similar numbers of males and females.
Figure 2: SVS K-Fold Cross Validation dialog.
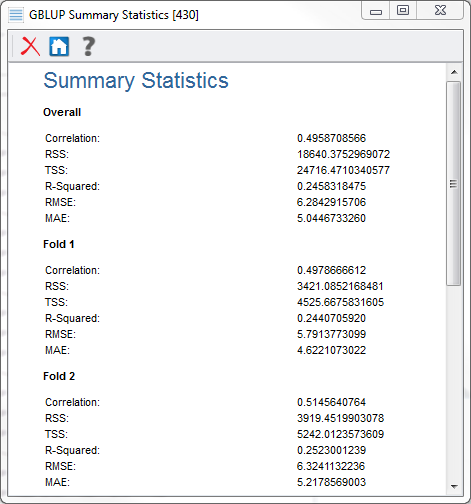
SVS gives prediction output for each iteration of the prediction process, including allele substitution effects (ASE) and predicted phenotypes. Upon completion, SVS will also give a summary of model performance, similar to Figure 3. The summary includes measures of correlation between actual and predicted phenotypes for the samples in each fold, together with combined measures of overall performance. In Figure 3, we see the overall results together with the individual results from the first two folds. We can see that the correlation of actual and predicted phenotypes is similar in each instance, with an R-squared of about 0.25.
Figure 3: Summary of 5-fold Cross-Validation using GBLUP.
Figure 4: Allele substitution effects calculated in each iteration of 5-fold cross-validation with GBLUP. In this example, we see that the same loci are most influential in each fold.
K-fold cross-validation for genomic prediction is a frequently-requested feature, and we are pleased to announce that it is now available in SVS. We will continue to build out this feature with additional options and outputs in upcoming releases. If you want to learn more about SVS or give it a test drive, please let us know!


Pingback: GxE Regression Option to be Available in SVS | Our 2 SNPs…®