VarSeq Updated with CNV Annotations, CNV PhoRank, and Region Assessment Catalogs
This year we have released multiple advances to support CNV analysis in VarSeq, expanding our target region based VS-CNV caller to handle exomes and low-depth genomes as well as additional supporting algorithms like calling Loss of Heterozygosity regions.
To top this off, VarSeq 1.4.7 has been shipped with many expanded capabilities to support the analysis, cataloging, and reporting of the CNVs called in VarSeq. These include a new set of annotation algorithms and expanded annotation catalogs designed specifically for CNV and other region-based data, as well as updates to the Assessment Catalog to store CNVs, regions, and per-sample information.
Annotations on Every Table
VarSeq 1.4.7 now supports annotation of virtually every table in VarSeq. This includes annotation of coverage regions, LoH regions, and CNVs, as well as support for computed fields and counts per gene on all tables. Now, annotating one of these secondary tables is as simple as clicking the ‘Add’ button and selecting the appropriate annotation choice from the Secondary Tables menu.

We have added a wide array of CNV annotation tracks. These include 1kG CNVs and Large Variants, which provides frequency information about CNVs, ClinVar and ClinGen, which provide clinical assessment and interpretation information, Genomic Super Dups, which includes regions that are highly homologous to other repetitive regions of the genome, and many others.
CNVs can also be annotated against our gene tracks, allowing our users to easily identify the set of genes and specific exons of those genes that overlap a given CNV event. For very large events that may cover thousands of genes, we limit the detailed per-transcript analysis to those that overlap either of the end-points of the CNV event.
Also, for understanding the function and clinical relevance of CNV events, we have the ability to annotate against our licensed OMIM gene and phenotype annotations as well as the ClinGen Haploinsufficiency and Triplosensitivy gene and region annotations.
Filters on Every Table
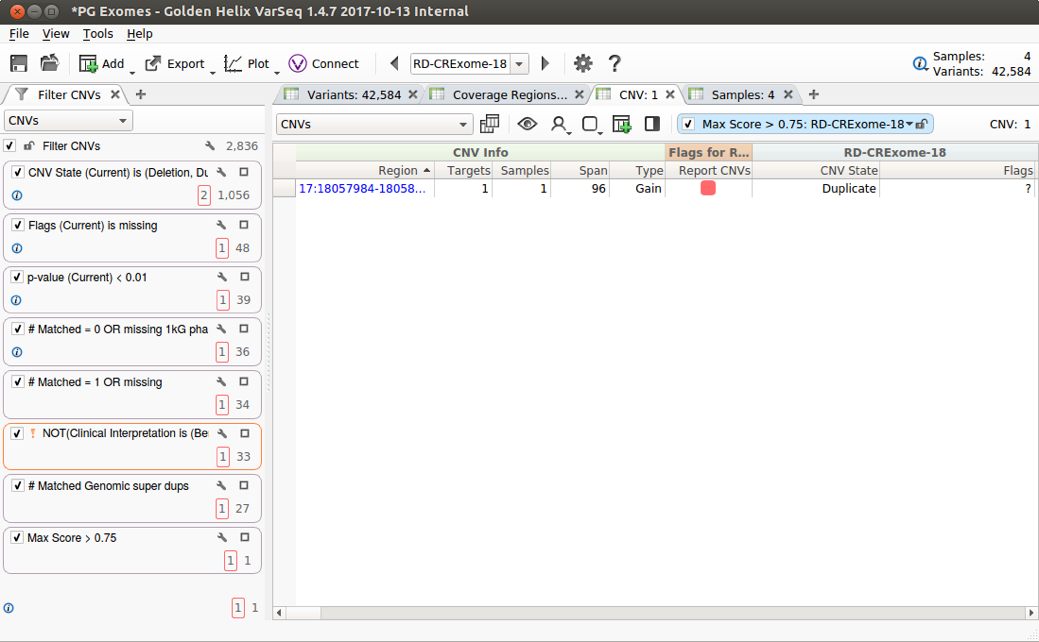
Previously, the only way to filter CNV tables was through VarSeq’s per-table queries, which works fine for one or two filters, but, for more complex CNV workflows including filters over several annotations, we want to use the same powerful filter chain used for our variant tables. With VarSeq 1.4.7, complex filter chains can be applied to any table in a project.

In the context of CNVs, filtering based on annotations allows users to reduce false positives and filter out common CNVs. Using this functionality, you can quickly examine a shortlist of clinically relevant CNVs.
PhoRank Your CNVs
To prioritize and rank the CNVs that have a high likelihood of impacting the observed symptoms, we have added CNV support for our phenotype driven gene ranking tool, PhoRank.
CNV PhoRank ranks CNVs and genes based on their relevance to user-specified phenotypes as defined by the GO and HPO biomedical ontologies. CNV PhoRank reports the names, scores, and ontology paths for the five highest-ranking genes overlapping a given CNV, along with the sum and maximum scores overall overlapping genes. By filtering and sorting on these scores, users can narrow the search space, prioritizing CNVs based on their genes’ relevance to an individual’s phenotypes.

Assessment Catalogs for Regions, CNVs, and Variants Too
Assessment Catalogs provide an interface to track variants across projects. Each stored variant can be annotated with custom information input through a form. Projects can use these custom assessment catalogs as annotation sources and variants can be filtered based on the stored values.
In VarSeq 1.4.7, assessment catalogs can now store CNV and Region information in addition to variants. CNVs in an assessment catalog are indexed on genomic position and CNV type, while Regions are simply indexed on position. However, custom keys can also be added to a catalog, allowing multiple records to exist for a given Variant, CNV, or Region. For example, you could have one assessment per sample, disease, or test assay.
Enhanced Exports
We have greatly enhanced the export capability in VarSeq 1.4.7. Both CNV and Region tables can now be exported as annotation tracks or exported directly to an assessment catalog. Also, the display of the genomic region field can now be customized, allowing Chromosome, Start, and Stop to be displayed and exported as separate fields.
Of course, it is impossible to cover all of the improvements to VarSeq in a single, short blog post. If you want to know more, check out our Release Notes for a full list of the many improvements and new features. Finally, we want to thank our many engaged users for their feedback and suggestions as we continue the development of VarSeq as a clinical interpretation suite.