We have just released SVS version 8.4.2, and included in the release is a new script for visualizing Meta-Analysis results with a Forest Plot. You can find full details on all the new and updated features included with the update in our Release Notes. Release Notes from all our software products can be found on our Support Bulletin web page at the following link.
https://www.goldenhelix.com/Support/Bulletins/index.php
You can also find the release notes through SVS by going to Help > SVS Manual and selecting the Release Note section under the Contents menu, the most recent ones will always be at the top.
Visualizing Meta-Analysis results with a Forest Plot
With this new version we have included a new script for generating Meta-Analysis Forest Plots. This new feature is a graphical display of the estimated results from a number of scientific studies addressing the same question, along with the overall results from the Meta-Analysis.
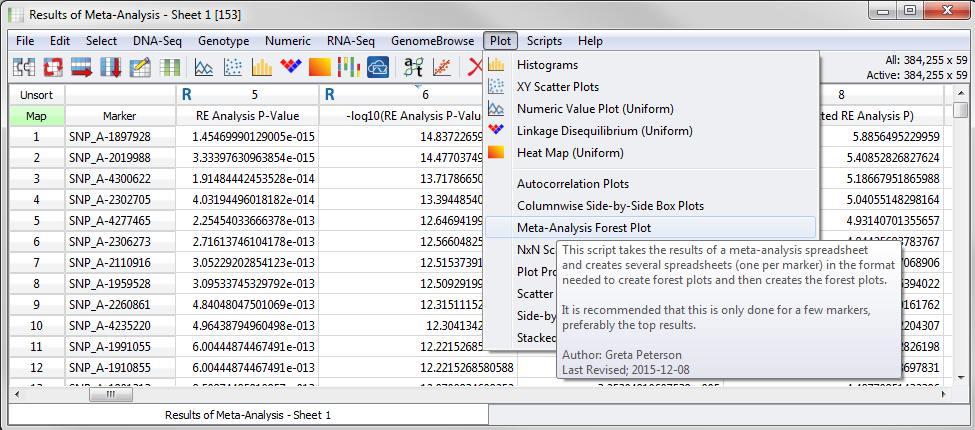
The new plot can be launched from the “Results of Meta-Analysis” output spreadsheet in SVS by going to Plot > Meta-Analysis Forest Plot. It is recommend that you first sort the data so the most significant p-values are at the top.
Fig.1. Launching the tool from the spreadsheet menu
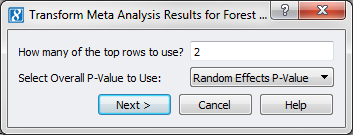
Then select how many of the top markers to use to generate plots from the data, and select which overall output column to consider. For example if I wanted to include plots based on “RE Analysis P-Values” from the 2 most significant markers in the analysis I would select 2 in the first box and “Random Effects P-Value” from the dropdown menu.
Fig.2. Plot options – Dialog 1
Now you will be given the option to rename your studies so the labels of the plot can be more informative. By default Study #1, Study #2, etc. will be used based on the column headers of the Meta-Analysis output.
Fig.3. Plot options – Dialog 2
The output of the script will be one spreadsheet and one plot for each marker selected in the first dialog. The spreadsheet will contain the summary information for each study along with overall information for the Meta-Analysis.
Fig.4. Summary spreadsheet for SNP_A-2219518
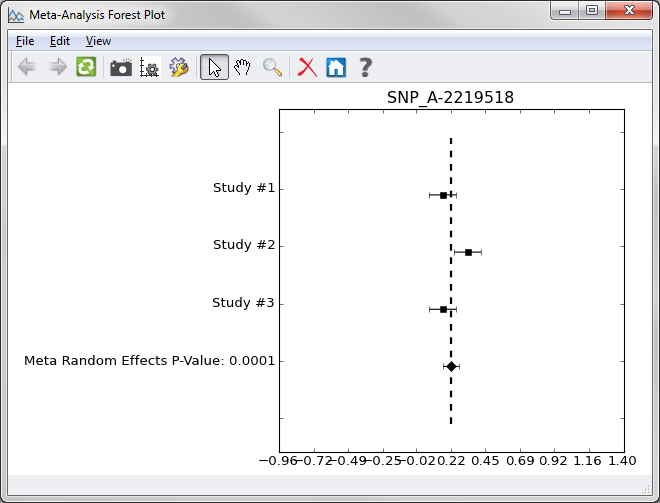
Included in the plot is a vertical dashed line representing the overall meta-analyzed measure of effect, and a vertical solid line, which is the line of no effect. If the confidence interval for an individual study overlaps with the line of no effect, it demonstrates that at the given level of confidence that individual study’s effect size does not significantly differ from ‘no effect’. The same applies for the meta-analyzed measure of effect: if the confidence interval around the diamond overlaps the line of no effect the overall meta-analyzed result cannot be said to differ from ‘no effect’ at the given level of confidence.
“Plot controls can be used to modify shapes and colors on the plot.
You can find further details on this script as well as Meta-Analysis functionality in SVS at the following links to our manual.
https://doc.goldenhelix.com/SVS/latest/svsmanual/meta_analysis.html#meta-analysis
https://doc.goldenhelix.com/SVS/latest/svsmanual/customPlots.html#meta-analysis-forest-plot
If you have any questions about the Meta-Analysis functionality or the Forest Plot script, please contact [email protected].


Great work. A quantitative study to systematically access and visualize is something which will helps us draft the conclusion of the previous research work in a satisfying way. We can always study and learn new concepts to develop the process.