Golden Helix has a long history of developing a high-quality NGS-based CNV caller. This has become even more apparent with our latest publication, where we teamed up with Twist Bioscience to demonstrate VarSeq capability of calling large copy number variants utilizing their clinical whole exome sequencing data.
You can access the recent publication here:
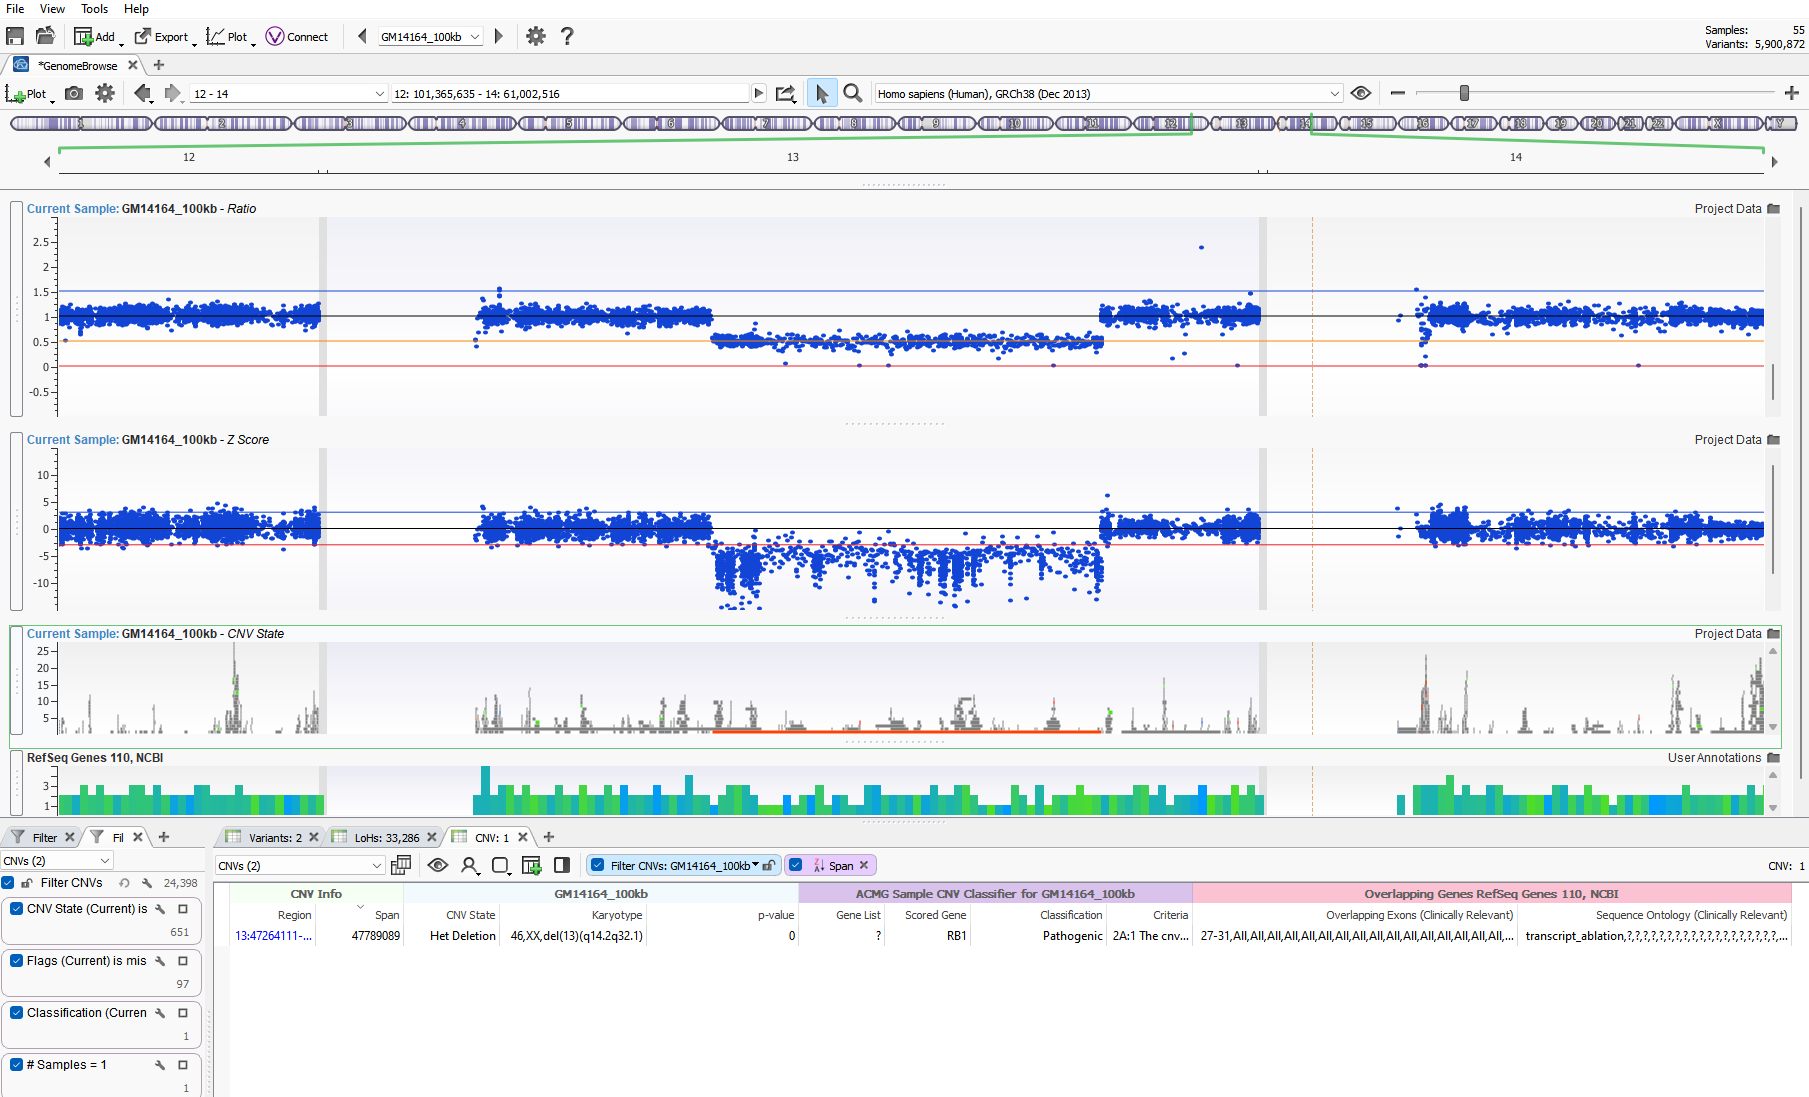
CNV detection aside, our users all eventually ask the same question, “how can I assess the quality of the CNV and determine if it is a real call or simply an artifact?” This is a fantastic question and one that doesn’t have a simple singular answer. Fortunately, VarSeq provides a number of quality flags at a variant and sample level to strengthen the assessment of any CNV event. If calling CNVs in VarSeq, we train our users to utilize the Zscore and Ratio metrics visually to assess the clarity of a CNV call. You can see in Figure 1 a substantial heterozygous deletion event spanning a large portion of Chr 13 (del(13)(q14.2q32.1)). This het deletion is indicated by a solid orange bar in the GenomeBrowse view. Additionally, the Ratio and Zscore metrics plotted above also represent the call. Without diving into too much detail, the main goal is to ensure that the drop of these data points is consistently below the baseline black line. This plot greatly represents a clean het deletion signal where all data points are below the normal adjacent diploid metrics. If a wide range of data points were scattered over each plot, the CNV signal may be considered noisy, and the variant likely not reportable due to lack of strength.
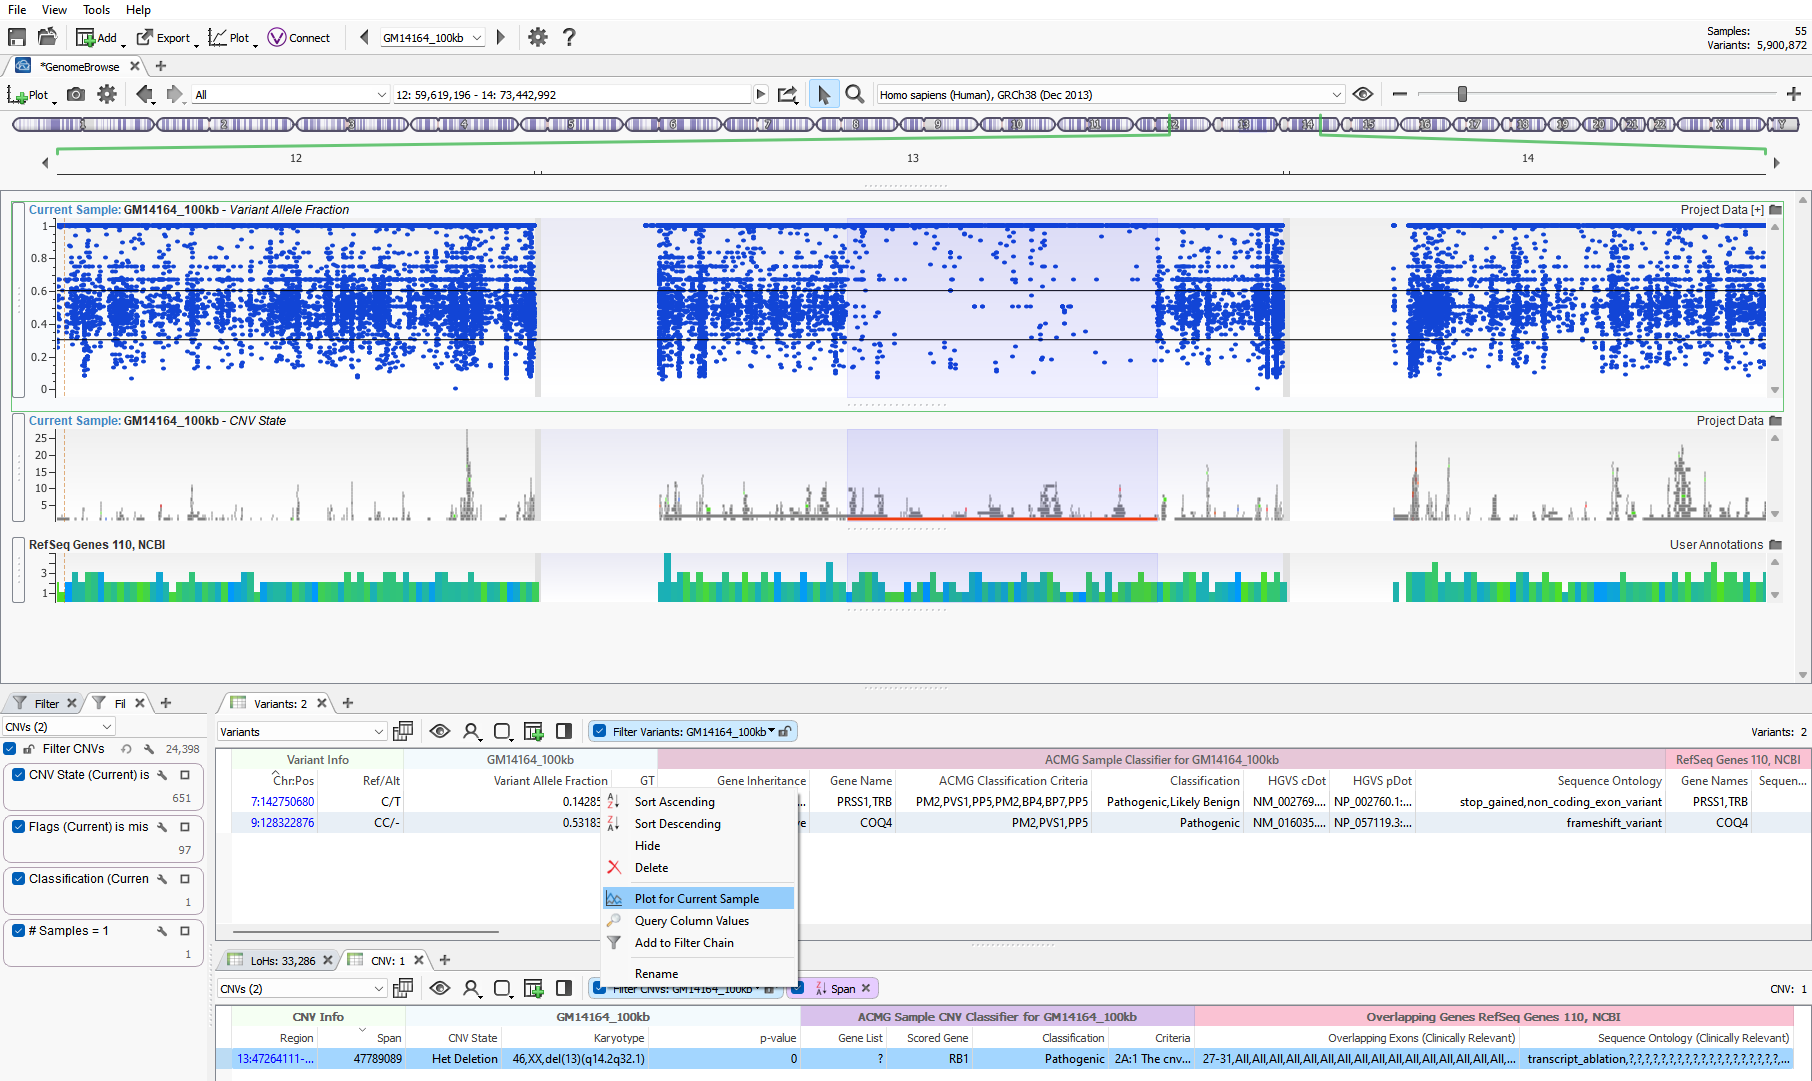
If you are not using VarSeq for your CNV calls, you can import any CNV calls into the software for assessment. VarSeq is agnostic to which caller is being used and will display any fields present in the VCF. However, many of the public CNV callers do not provide metrics at a target level to assess the quality of the CNV signal. There is an alternative metric to plot that you should see in the VCF regardless of which caller is used. Users can plot the Variant Allele Fraction, which is shown in Figure 2. The plot seen below is of the same Chr 13 het deletion where it is clearly seen the region of loss of heterozygosity overlaps the CNV event. In the VAF plot, two black lines are set at 0.3 and 0.6 to define the boundaries of where you’d expect most heterozygous variants. The absence of these heterozygous variants supports the heterozygous deletion in that region.
If you seek to import your external CNV calls or perhaps would like to test the VarSeq CNV calls, please contact us at [email protected]. If you are a current VarSeq user, reach out to our support team ([email protected]). We can assist you with importing and generating your CNV calls and provide some solid recommendations on plotting options to streamline your downstream assessments of variant quality.