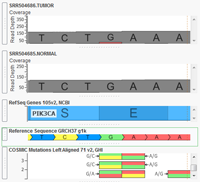
A prerequisite for clinical NGS interpretation is ensuring that the data being analyzed is of high enough quality to support the test results being returned to the physician. The keystone of this quality control process is coverage analysis. Coverage analysis has two distinct parts. Ensure that there is sufficient coverage to be confident in called variants Make certain that no… Read more »
VarSeq now supports analysis of paired Tumor/Normal samples! Tumor/Normal support has been one of the most common feature requests for VarSeq since it was launched late last year, and we are excited to make this functionality available to all of our VarSeq users in the latest update (version 1.1.4). VarSeq is a powerful platform for annotation and filtering of DNA… Read more »
One of the lesser known functions in SVS allows the user to create Venn diagrams comparing variants found in multiple spreadsheets. These different spreadsheets could come from individuals samples, a case vs. control group or several variant databases. It is a helpful tool for visually comparing different variants. Start by creating spreadsheets for each group/samples you’d like to compare. The… Read more »
Our VarSeq as a Clinical Platform webcast last week highlighted some recent updates in VarSeq that support gene panel screenings and rare variant diagnostics. The webcast generated some good questions, and I wanted to share them with you. If the questions below spark new questions or need clarification, feel free to get in touch with us at [email protected]. Question: Should… Read more »
Over 650 GenomeBrowse licenses have been registered and downloaded since the beginning of 2015, and with so many people enjoying the utility of this freeware program, I wanted to showcase some advanced tips and tricks so you can get more out of GenomeBrowse! Under the Controls panel, when you’re clicked inside a data plot, there is a “Filter” tab. This… Read more »
I am constantly on the lookout for fun or interesting datasets to analyze in SVS or VarSeq and recently came across a study looking into inherited cardiac conduction disease in an extended family (Lai et al. 2013). The researchers sequenced the exomes from five family members including three affected siblings and their unaffected mother and an unaffected child of one… Read more »
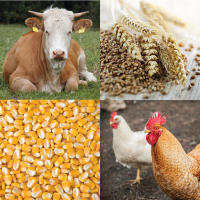
Our Genomic Prediction webcast in December discussed using Bayes-C pi and Genomic Best Linear Unbiased Predictors (GBLUP) to predict phenotypic traits from genotypes in order to identify the plants or animals with the best breeding potential for desirable traits. The webcast generated a lot of good questions as our webcasts generally do. I decided to begin to share these Q&A… Read more »
One frequent question I hear from SVS customers is whether whole exome sequence data can be used for principal components analysis (PCA) and other applications in population genetics. The answer is, “yes, but you need to be cautious.” What does cautious mean? Let’s take a look at the 1000 Genomes project for some examples.
If you’ve seen the recent webinars given by Gabe Rudy and Bryce Christensen, you’ve no doubt been impressed by the capabilities of VarSeq when it comes to annotation and filtering. However, we sometimes forget that the power that enables all this complex analysis can also be used in more mundane tasks like VCF subsetting. And although these day-to-day tasks don’t… Read more »
A helpful tool that is included in SVS, but many of our customers may not know about, is the ability to create Box Plots or box-and-whisker plots. These are effective visualizations for comparing groups of numerical data through the data quartiles. I’ll take you through a couple different cases with examples.
In our recent webcast, Advancing Agrigenomic Discoveries with Sequencing and GWAS Research, Greta Linse Peterson featured bovine data which she download from the NCBI website. The data was downloaded in SRA format and in order to analyze the data in SVS, the files had to be converted to BAMs and then merged into a single VCF file. Since many of… Read more »
In a recent blog post (Comparing BEAGLE, IMPUTE2, and Minimac Imputation Methods for Accuracy, Computation Time, and Memory Usage), Autumn Laughbaum compared three imputation programs. Data can be exported from, or imported into, SVS in the standard file formats for these and other imputation programs. The goal of this blog post will be to review the different tools available to… Read more »
Last week Khanh-Nhat Tran-Viet, Manager/Research Analyst II at Duke University, presented the webcast: Insights: Identification of Candidate Variants using Exome Data in Ophthalmic Genetics. (That link has the recording if you are interested in viewing.) In it, Khanh-Nhat highlighted tools available in SVS that might be under used or were recently updated. These tools were used in his last three… Read more »
Thank you to everyone who joined us yesterday for a webcast by Dr. Ken Kaufman of Cincinnati Children’s Hospital: “Identification of Candidate Functional Polymorphism Using Trio Family Whole Exome DNA Data.” Over 750 people registered for this event and 430 attended – a new Golden Helix record! If you missed the webcast (or would like to watch it again), the… Read more »
My work in the GHI analytical services department gives me the opportunity to handle data from a variety of sources. I have learned over time that every genotyping platform has its own personality. Every time we get data from a new chip, I tend to learn something new about the quirks of genotyping technology. I usually discover these quirks the… Read more »
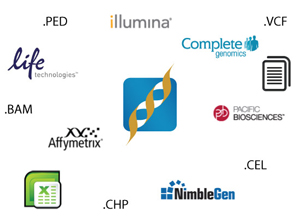
As most in the Golden Helix community are aware, SNP & Variation Suite (SVS) can handle all sorts of data including files from Affymetrix, Illumina, Agilent, and Complete Genomics with its powerful data management capabilities. Announced in February, SVS is now part of the Pacific Biosciences Partner Program and has the ability to analyze PacBio files.
Speaking as somebody with a long history in data analysis, there are few things I find more exciting and tantalizing than new analysis methods that might apply to a problem I am trying to solve or was unable to solve in the past. Whenever I make a breakthrough in one project, I find I want to abandon the current project… Read more »
Manipulating a marker map in SVS has never been easier, thanks to expanded functionality in SVS 7.5. Have you ever wanted to view annotation data next to marker map data? Or expand the current marker map with spreadsheet data to create a custom map? SVS 7.5 features two new functions that can accomplish these tasks. Adding Annotation Data to a… Read more »
Golden Helix’ SNP & Variation Suite (SVS) has a Regression Module to enable researchers with varying degrees of statistical knowledge to interrogate their data using regression models to account for potential confounding effects of covariates and interaction terms. While these tools are labeled “basic”, they can be difficult to use and results hard to interpret for those who have only… Read more »
Please see our updated tutorials for CNV Analysis by visiting: https://www.goldenhelix.com/resources/SNP_Variation/tutorials/index.html The following statement is representative of a common question that is posed to the Golden Helix support team: “I followed all of the steps in the SVS7 CNV analysis tutorial, but my results seem kinda funny. The segment means are skewed to the left and it doesn’t look like… Read more »


